
Weekly Commentary: 27 March 2023 – 02 April 2023
 Returns across the major benchmarks varied widely as recession worries and banking crisis still weighed heavily on investors’ mind. Treasury yields fell as investors are risk-off and buying safe haven debt. In the past week, Deutsche Bank was the next bank to have risk of bankruptcy as cost of insuring the German’s bank debt against the risk of default jumped to a more than four-year high. Deutsche Bank tumbled 8.5% after a sharp jump in insuring against default of the firm. The Federal Reserve had also raised official short-term rates by 25 bps. They have raised rates despite stress in the banking industry following the collapse of 2 regional banks. The FED’s rate-setting committee believe there are more room for higher rates to restore price stability and will climb to another quarter-percentage point by the end of the year.
US-China relations were further strained as lawmakers at a House Hearing peppered Tiktok CEO, Shou Zi Chew on the app’s ties to China, and China retaliated and said that they would fight any US attempt to force the company’s sale by its Chinese owners.
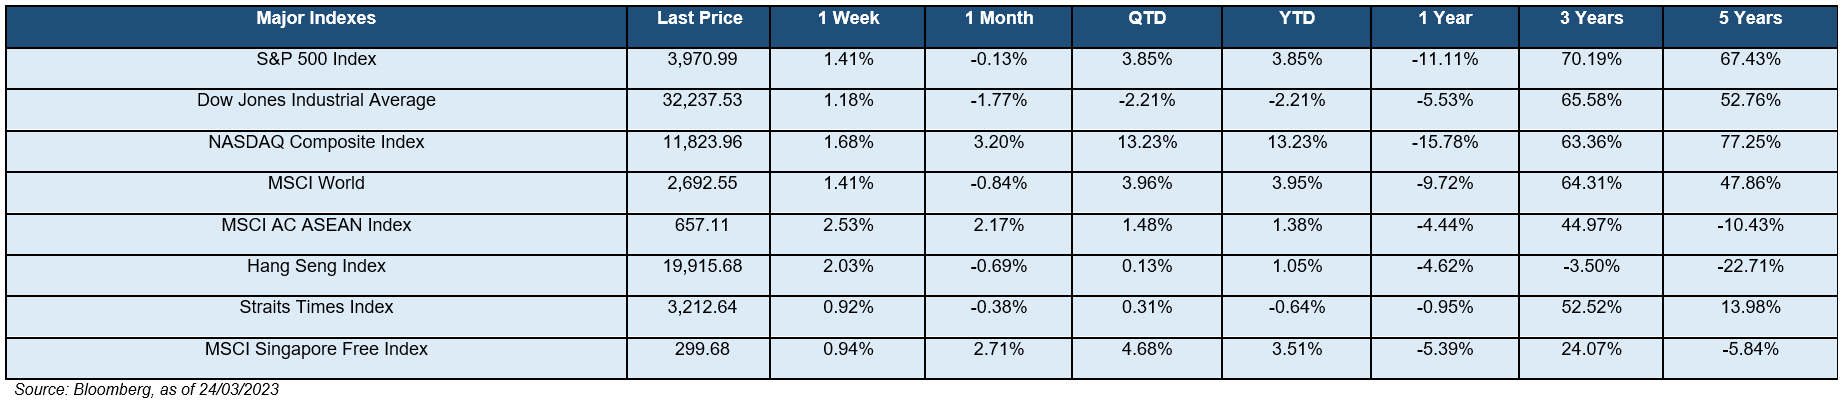
Stock returns were mixed over the week as observed across the following 3 indices, with the Dow Jones Industrial Average (+1.18%), S&P 500 Index (1.41%), NASDAQ Composite Index (+1.68%). Other key market indices that generated positives returns consist of MSCI World (+1.41%), Hang Seng Index (+2.03%), and MSCI AC ASEAN Index (+2.53%). 3 S&P 500 sectors registered losses this week – Utilities (-1.16%) and Real Estate (-1.30%). Main outperformers for the week were from subsectors such as Communication Services (+3.40%) and Energy (+2.29%) and Materials (+2.16%). For 2022 as a whole, index returns were negative for the Dow Jones Industrial Average (-8.78%), S&P 500 (-19.44%) and the NASDAQ Composite (-33.10%).
The yield-curve remains inverted as the 10Y-2Y US Treasury spread widened 5bps to -0.46%, driven by U.S 2-year and 10-year Treasury yields rising 3 bps to 3.87% and -2 bps to 3.40% respectively. Market sentiment also became more risk-off as the U.S. High Yield (HY) – Investment Grade (IG) credit spread tightened 16bps to 3.67% while the CBOE Volatility Index (VIX) has dropped lower by 377 bps to 21.75%.
This coming week, the Commerce Department reports on US household spending and income in February. Consumer spending jumped 1.8% in January from the prior month. They will also release its personal-consumption expenditures price index. The European Union will also release March inflation figures for the eurozone. The bloc’s February consumer prices were 8.5% yoy, the fourth straight month of easing Eurozone inflation.
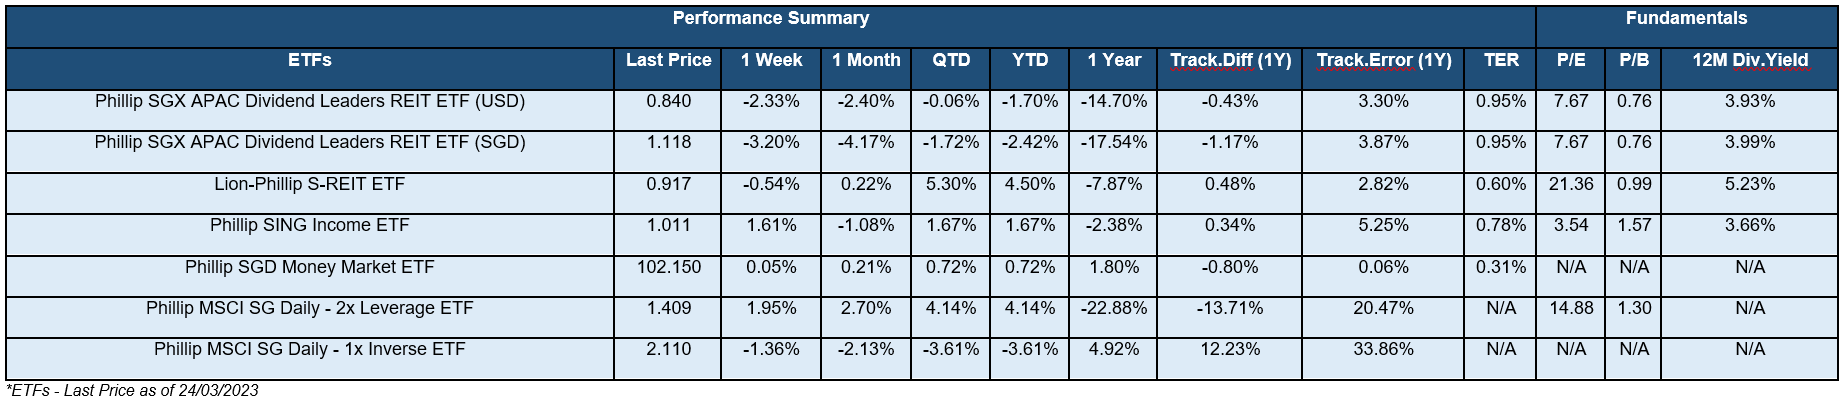
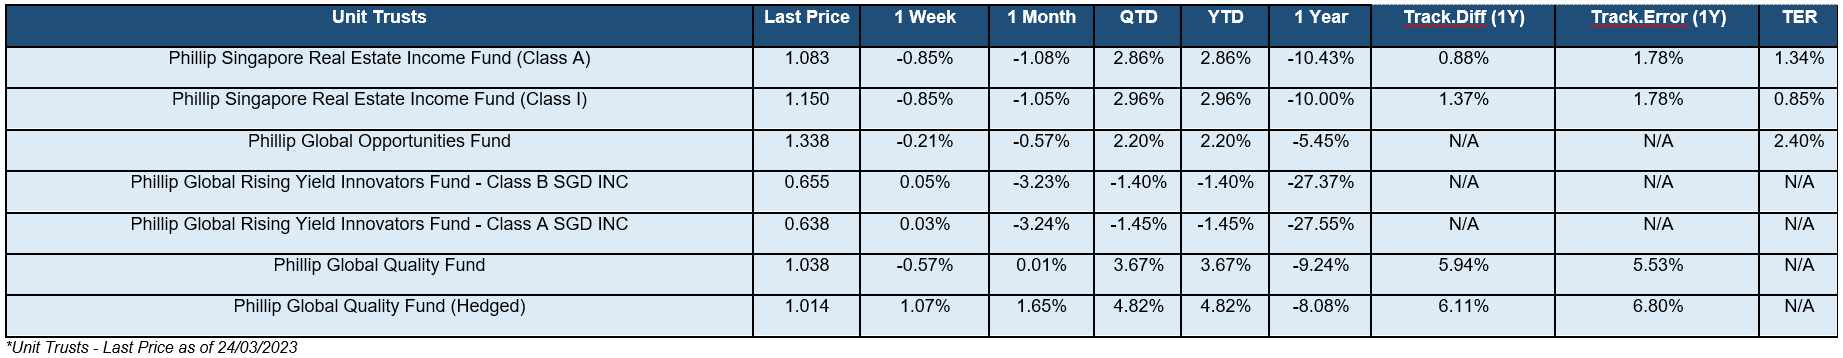
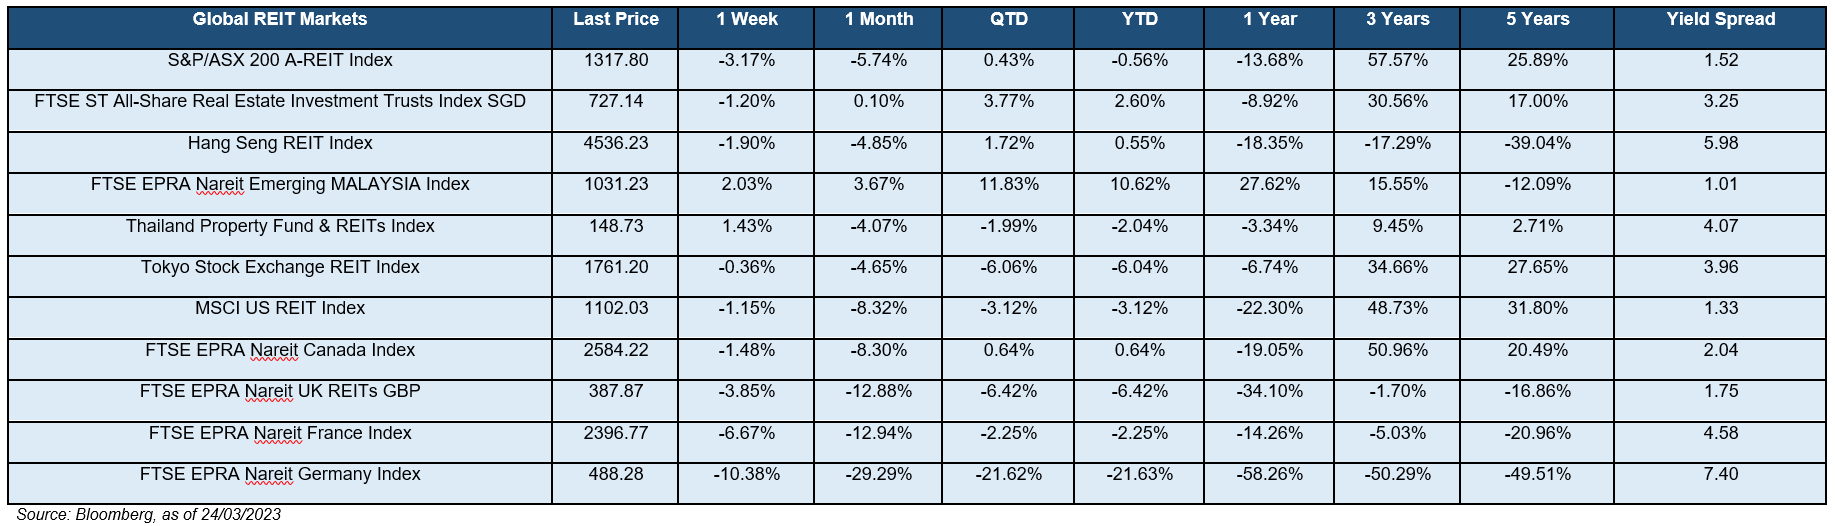
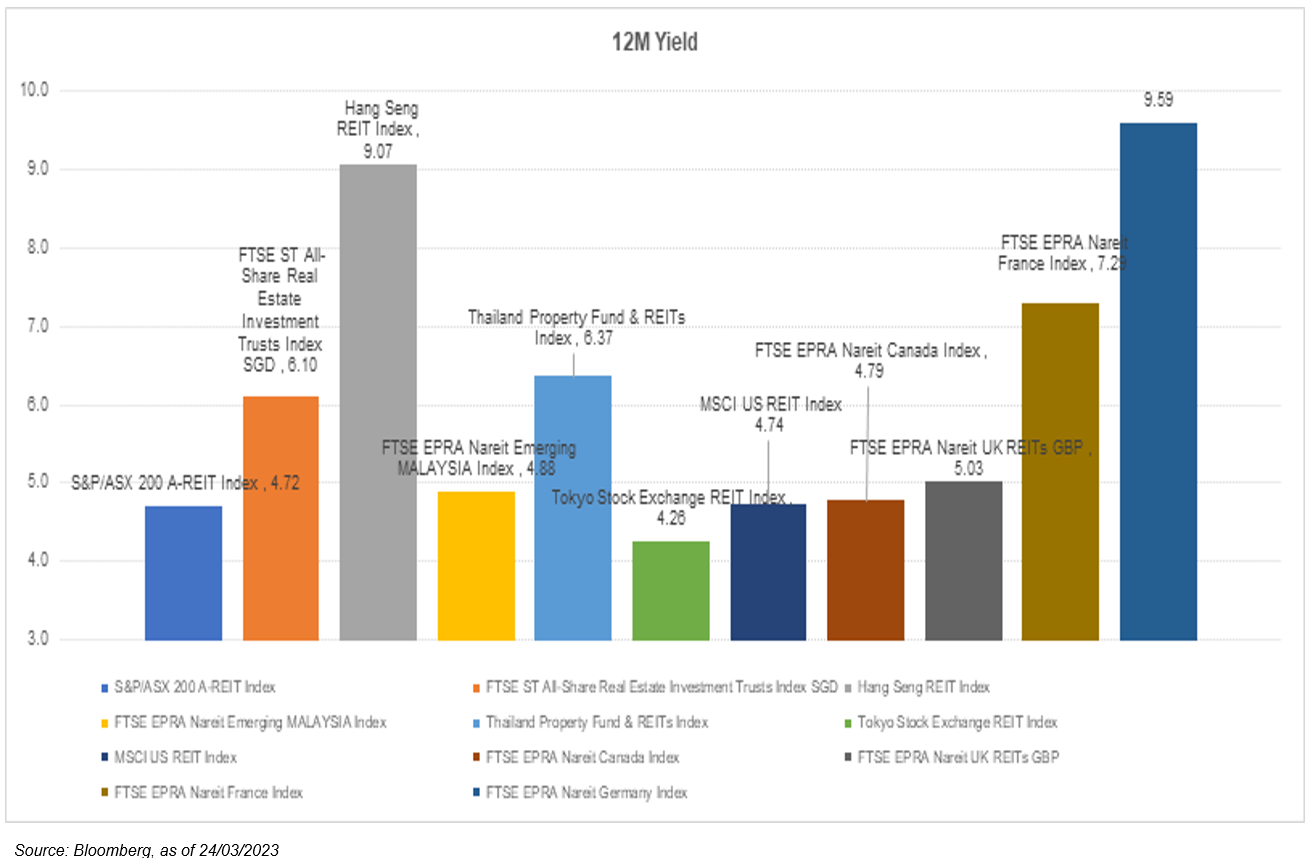
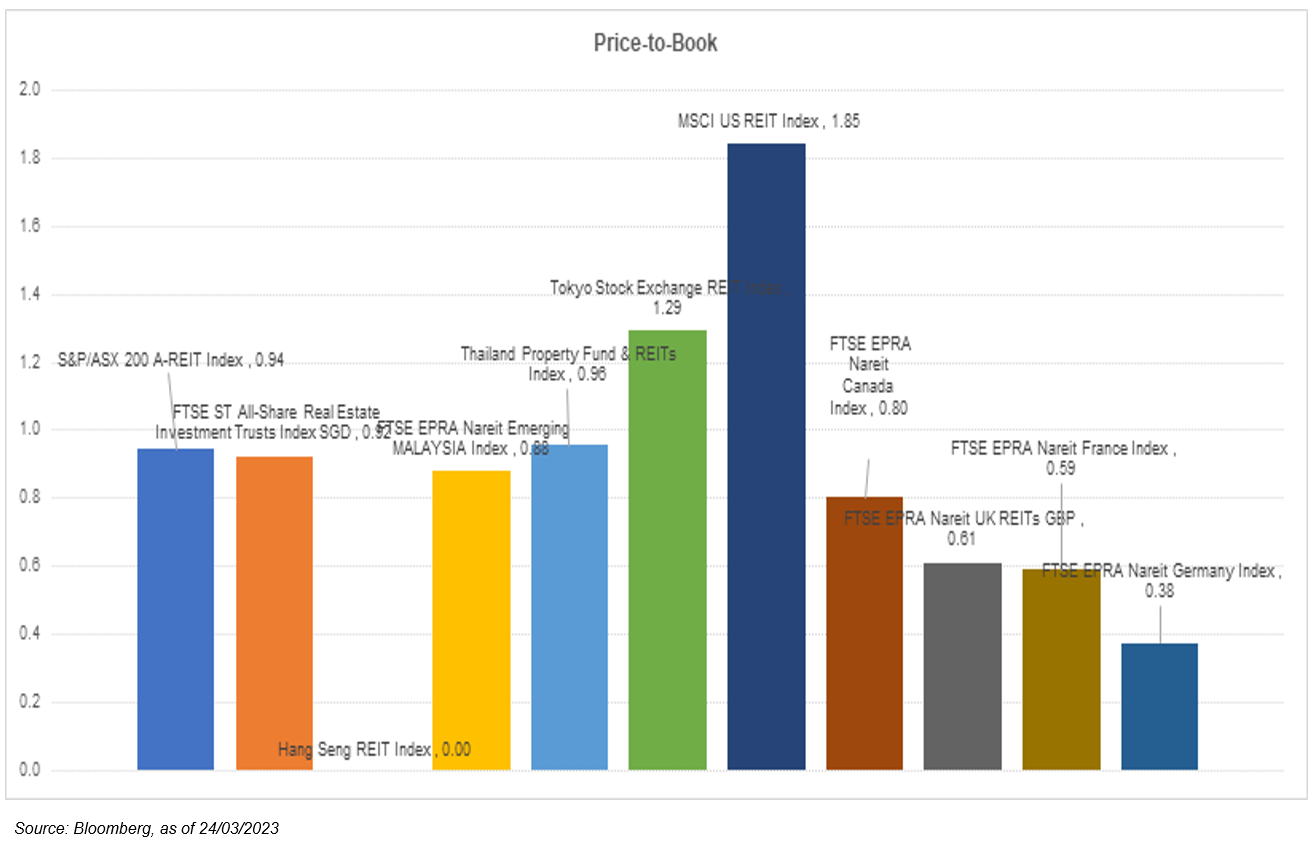
 The global REIT market’s return was varied across the numerous benchmarks. Hang Seng REIT index ( -1.90%), ASX 200 A-REIT Index (-3.17%), and FTSE EPRA Nareit Germany Index (-10.38%) were the REITs that dropped more relative to the rest. Closer to home, the iEdge S-REIT Index (-1.22%) and all of its subsectors generated negative weekly returns with Healthcare (-2.16%), Data Center (-3.08%), Office (-4.00%) was the notable sector that drops the most last week. REITs generally have been affected by decreasing yield spread as interest rates surged and investors price in the possibility of reduced distributions stemming from higher financing costs. However, we do expect inflows to return to the sector given the existing attractive valuations on offer and resilience offered by the REIT asset class in light of the waning global growth outlook.
Important Information
This material is provided by Phillip Capital Management (S) Ltd (“PCM”) for general information only and does not constitute a recommendation, an offer to sell, or a solicitation of any offer to invest in any of the exchange-traded fund (“ETF”) or the unit trust (“Products”) mentioned herein. It does not have any regard to your specific investment objectives, financial situation and any of your particular needs. You should read the Prospectus and the accompanying Product Highlights Sheet (“PHS”) for key features, key risks and other important information of the Products and obtain advice from a financial adviser (“FA“) before making a commitment to invest in the Products. In the event that you choose not to obtain advice from a FA, you should assess whether the Products are suitable for you before proceeding to invest. A copy of the Prospectus and PHS are available from PCM, any of its Participating Dealers (“PDs“) for the ETF, or any of its authorised distributors for the unit trust managed by PCM.
An ETF is not like a typical unit trust as the units of the ETF (the “Units“) are to be listed and traded like any share on the Singapore Exchange Securities Trading Limited (“SGX-ST”). Listing on the SGX-ST does not guarantee a liquid market for the Units which may be traded at prices above or below its NAV or may be suspended or delisted. Investors may buy or sell the Units on SGX-ST when it is listed. Investors cannot create or redeem Units directly with PCM and have no rights to request PCM to redeem or purchase their Units. Creation and redemption of Units are through PDs if investors are clients of the PDs, who have no obligation to agree to create or redeem Units on behalf of any investor and may impose terms and conditions in connection with such creation or redemption orders. Please refer to the Prospectus of the ETF for more details.
Investments are subject to investment risks including the possible loss of the principal amount invested, and are not obligations of, deposits in, guaranteed or insured by PCM or any of its subsidiaries, associates, affiliates or PDs. The value of the units and the income accruing to the units may fall or rise. Past performance is not necessarily indicative of the future or likely performance of the Products. There can be no assurance that investment objectives will be achieved. Any use of financial derivative instruments will be for hedging and/or for efficient portfolio management. PCM reserves the discretion to determine if currency exposure should be hedged actively, passively or not at all, in the best interest of the Products. The regular dividend distributions, out of either income and/or capital, are not guaranteed and subject to PCM’s discretion. Past payout yields and payments do not represent future payout yields and payments. Such dividend distributions will reduce the available capital for reinvestment and may result in an immediate decrease in the net asset value (“NAV”) of the Products. Please refer to <www.phillipfunds.com> for more information in relation to the dividend distributions.
The information provided herein may be obtained or compiled from public and/or third party sources that PCM has no reason to believe are unreliable. Any opinion or view herein is an expression of belief of the individual author or the indicated source (as applicable) only. PCM makes no representation or warranty that such information is accurate, complete, verified or should be relied upon as such. The information does not constitute, and should not be used as a substitute for tax, legal or investment advice.
The information herein are not for any person in any jurisdiction or country where such distribution or availability for use would contravene any applicable law or regulation or would subject PCM to any registration or licensing requirement in such jurisdiction or country. The Products is not offered to U.S. Persons. PhillipCapital Group of Companies, including PCM, their affiliates and/or their officers, directors and/or employees may own or have positions in the Products. This advertisement has not been reviewed by the Monetary Authority of Singapore.