
Market Commentary – May 2024
Equity Market Update:
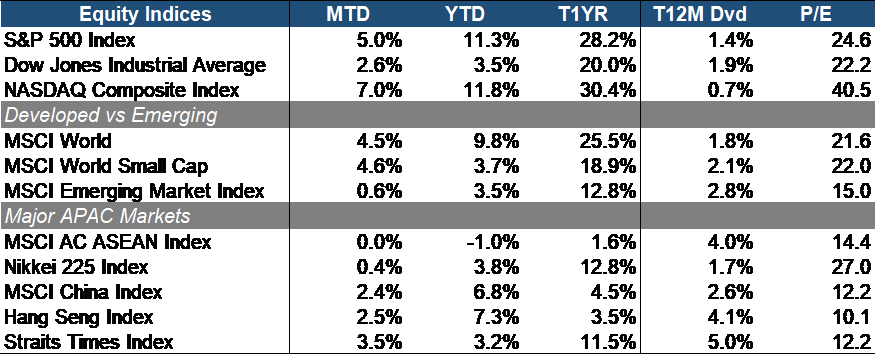
Photo source: Phillip Capital Management (S) Ltd
In May, the equity market rallied, with the S&P 500 gaining 5% month-to-date (MTD). Growth outperformed value, evidenced by the DJIA’s 2.6% MTD return trailing the tech-heavy NASDAQ Composite’s 7% MTD return.
Developed market equities rose 4.5% MTD, outpacing emerging markets’ 0.9% MTD, expanding their lead for the year by about 6.3%. Small caps, up 4.6% MTD, slightly outperformed large and mid-caps as investors sought quality.
In the APAC region, Chinese (+2.4% MTD) and Hong Kong equities (+2.5% MTD) lagged behind Singapore equities (+2.2% MTD) but outperformed the flat ASEAN equity market. Japanese equities were the worst performers in May due to concerns over weak yen, slowing in consumption, and potential monetary policy tightening.

Photo source: Phillip Capital Management (S) Ltd
Most sectors in the S&P 500 index saw gains in May, except for Energy, which declined by 0.4% MTD. Consumer Discretionary and Industrial were among the top three underperforming sectors. In contrast, InfoTech (+10.1% MTD), Utilities (+9% MTD), Communication Services (+6.6% MTD), and Real Estate (+5.1% MTD) outperformed, buoyed by mostly positive Q1 2023 earnings results and cooling inflation data.
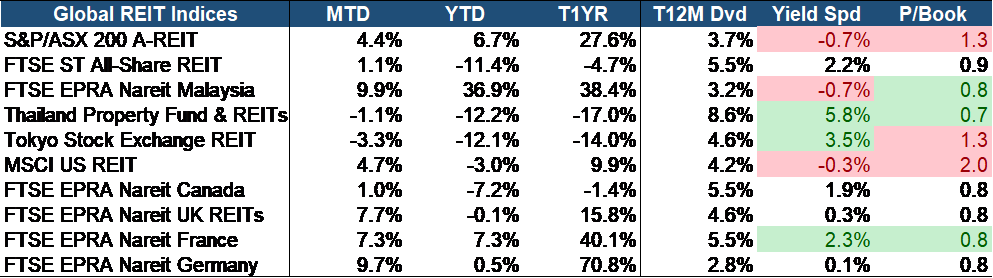
Photo source: Phillip Capital Management (S) Ltd
In the global REIT markets, most experienced a rebound last month, with the exception of Japan and Thailand REITs. Singapore REITs saw a modest 2.2% MTD gain, and their yield spread remained one of the most attractive globally at 2.2%. Despite facing challenges such as inflation and policy tightening impacting SREITs’ distributions, we maintain a positive outlook for the sector. SREITs continue to be attractive due to the quality of their underlying assets, appealing yield, and undervalued valuation (0.9 Price-to-Book), which stands significantly below historical averages.
Equity Market Outlook:

Photo source: Phillip Capital Management (S) Ltd
The stock market turned risk-on last month, with the VIX dropping by 273 bp month-over-month and staying below its three-month average. Nevertheless, investors caution remains apparent moving forward, as indicated by the 9 bp widening of the credit spread between High Yield and Investment Grade bonds.
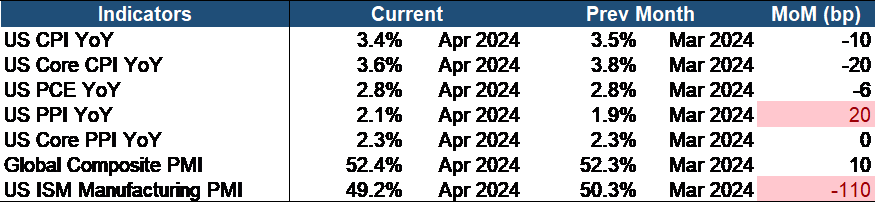
Photo source: Phillip Capital Management (S) Ltd
Recent economic data has been largely positive, contributing partly to the rebound in equity market performance. Inflation indicators, including headline and core Consumer Price Index (CPI) as well as the Personal Consumption Expenditures (PCE) index, a key metric monitored by the Fed, have decreased compared to the prior month, suggesting some cooling. However, the rise in the headline Producer Price Index (PPI), despite the core PPI remaining unchanged, indicates that inflationary pressures persist, as PPI often serves as a leading indicator for inflation.
The first quarter of 2024 has delivered notably favorable earnings results, demonstrating resilience in the current uncertain market environment. According to FactSet, with 98% of S&P 500 companies reporting, 78% have surpassed expectations in terms of earnings per share (EPS), and 61% have exceeded revenue projections. The blended year-over-year earnings growth rate stands at 5.9%, marking the highest since Q1 2022’s 9.4%. This represents a significant improvement from the 3.4% estimate provided on March 31, primarily propelled by positive EPS surprises across ten sectors.
We anticipate upbeat earnings to continue in the second half of 2024, especially driven by leading tech companies known for their ability to generate robust cash flows even in economic downturns, supported by substantial cash reserves. Moreover, we are only beginning to realize the potential of AI to boost earnings further. Another rate cut will propel equities further, but we expect the current level to hold until Q1 2025 due to the Fed stalling progress in bringing down inflation to its 2% goal.
China Market Update:
The economic data for April showed mixed signs as exports and manufacturing showed resilience, while retail sales were below expectations. There are signs of dual track economy as supply side indicators supported by policy are better than demand side indicators. The property sector plays a crucial role in China’s economy which contributed 25% of National GDP at peak in 2020-21. Housing revenues have fallen by 25-30% from these highs but still contribute to 65% of China household’s wealth. There is major development with central government and People’s Bank of China (PBOC) coordinating to roll out measures to boost property demand and digest supply.
On 17th May, the central government announced a scheme to encourage local governments to buy unsold properties from developers to convert into affordable housing. In summary, the PBOC removed nationwide floor rates for commercial mortgages and allocated Rmb300bn (US$42bn) in low-cost “refinancing funds” to 21 national banks. These funds cover 60% of the loans’ principal, with an interest rate of 1.75% for a one-year term, extendable four times. Notably, the national minimum down payment ratio decreased to 15% for first-time buyers and 25% for second homes, while the minimum mortgage rate was scrapped. Additionally, a CNY 300bn relending program supports housing destocking by enabling state-owned enterprises to purchase unsold commercial homes for subsidized housing conversion.
We believe China is taking steps in the right direction to end the housing crisis but investors will have to be patient to see the effectiveness of the same. These efforts represent the most comprehensive property easing initiatives since 2021 and instil hope among investors. As the world’s second-largest economy, China achieved a 5.3% growth in FY23 and is projected to grow by 4.8% in 2024 and 4.1% in 2024-2025. With valuations at only 60% of the Market Capitalization to GDP ratio compared to India’s 120% and the US’s 180%, as well as Japan’s 166%, China presents an attractive investment opportunity due to its growth potential and affordability.
Fixed Income Update:
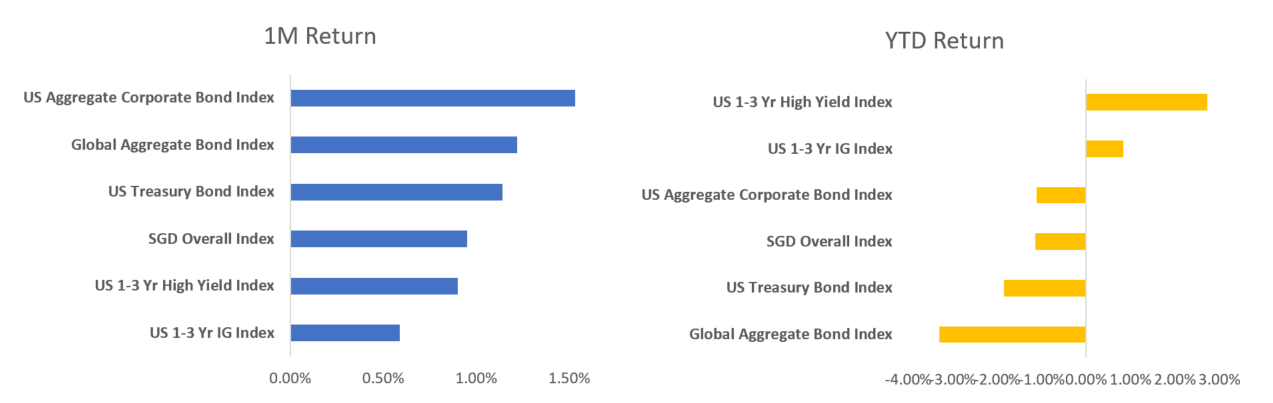
Photo source: Phillip Capital Management (S) Ltd
Major bond market indices generally finished the month of May positive, though not without a slight pullback sometime in the middle of the month. This came on the heels of some comments by FED officials about how the US central bank would be prepared to hold rates higher for an extended period of time if substantial progress on inflation was not being made. Federal Reserve Bank of Minneapolis President Neel Kashkari even went so far as to suggest that a rate hike should not be entirely ruled out. This rattled markets and sent the US10Y treasury yield surging by almost 30bps from its recent low of 4.344% on May 15 to as high as 4.619% on May 29. As of May 31, the 10-year yield settled at around 4.5%.
In terms of relative performance for the month, we see some outperformance in the US corporate bond space over the global aggregate index while shorter duration bonds and SGD bonds lagged slightly. On a YTD basis, we see shorter duration bonds performing as they are intended to by holding up better in an environment of rate volatility and delivering positive returns while their longer dated counterparts are still negative on the year.
Weak US Treasury Auction Demand Persists
On May 28, 2024, the US Treasury held auctions for 2-year and 5-year treasury notes. Both auctions saw poor demand, reflected in bid-to-cover ratios that were at their lowest level on a 1-year basis. The 2-year auction bid-to-cover ratio was 2.41x (vs 2.86x in Jun 2023) and the 5-year auction bid-to-cover ratio was 2.3x (vs 2.52x in Jun 2023). This subdued investor interest could point to the problem of potential oversupply of US treasuries in the market and could be a contributor to higher bond yields.
This also goes back to a point we made in our April 2024 commentary about US economic outperformance being driven by high levels of deficit spending. Weak auction demand from private bidders implies that the FED will have to step in to make up for that shortfall which is in essence a form of QE. This will needless to say have an inflationary impulse by increasing money supply which could then eventually work its way into higher consumer prices.
High Yield Spreads Narrow Despite Further Deterioration in Credit Fundamentals
In spite of a slew of weak economic data – notably Manufacturing PMI for May coming in at 48.7 (vs 49.2 in April), we continue to see the outperformance of the high yield credit space relative to the global aggregate index. As seen in the chart above, US 1-3 Yr HY bonds returned 2.7% on a YTD basis compared to the global aggregate bond index which was down -3.3% and even outperformed US 1-3 Yr IG bonds which are only up 0.8% YTD. In fact, high yield spreads on an option-adjusted basis are at their tightest levels since 2007.
A major catalyst for the rush into the high yield space since the start of 2024 was due to the infamous “Powell pivot” in late December 2023. With average YTMs hovering around the 8% level and the specter of rate cuts on the horizon, this proved to be an asset class that was too attractive for money managers and institutional investors to ignore, in spite of elevated default risk. According to Moody’s research, the default rate among junk-rated borrowers came in at 5.8% on a TTM basis.
Another theory for this strength in the high yield market was that some of the companies that went bankrupt thus far in the credit cycle were the ones that were already weak fundamentally heading in to the cycle. This leaves behind a remaining batch of high yield corporates with stronger balance sheets which have thus far weathered higher interest rates rather well keeping high yield spreads range-bound in the recent months. The market will no doubt be keeping a keen eye on any sudden increase in default distress especially if a “high-for-longer” scenario was to play out in the coming months.
Singapore Government Issues S$2.5B Worth of 30-Yr Green Bonds
On May 21 2024, the Singapore government issued S$2.5B worth of 30-Yr sovereign green bonds which are also known as Green Singapore Government Securities (Infrastructure). According to reporting by theasset.com, the issue saw strong demand which resulted in the final offer yield to come in at 3.3% which was 16bps tighter than the initial pricing guidance of 3.46%. Insurance companies were the biggest buyers of the bonds accounting for 53%, followed by fund managers, central banks and other investors at 32% and banks at 15%.
The proceeds from this 30-year bond issuance will be used to finance projects covered under the government’s green investment framework. One such project would be expanding its rail network in the form of two new lines known as the Cross-Island Line and the Jurong Region Line which will further improve connectivity for commuters within the city-state.
Important Information
This material is provided by Phillip Capital Management (S) Ltd (“PCM”) for general information only and does not constitute a recommendation, an offer to sell, or a solicitation of any offer to invest in any of the exchange-traded fund (“ETF”) or the unit trust (“Products”) mentioned herein. It does not have any regard to your specific investment objectives, financial situation and any of your particular needs. You should read the Prospectus and the accompanying Product Highlights Sheet (“PHS”) for key features, key risks and other important information of the Products and obtain advice from a financial adviser (“FA“) before making a commitment to invest in the Products. In the event that you choose not to obtain advice from a FA, you should assess whether the Products are suitable for you before proceeding to invest. A copy of the Prospectus and PHS are available from PCM, any of its Participating Dealers (“PDs“) for the ETF, or any of its authorised distributors for the unit trust managed by PCM.
An ETF is not like a typical unit trust as the units of the ETF (the “Units“) are to be listed and traded like any share on the Singapore Exchange Securities Trading Limited (“SGX-ST”). Listing on the SGX-ST does not guarantee a liquid market for the Units which may be traded at prices above or below its NAV or may be suspended or delisted. Investors may buy or sell the Units on SGX-ST when it is listed. Investors cannot create or redeem Units directly with PCM and have no rights to request PCM to redeem or purchase their Units. Creation and redemption of Units are through PDs if investors are clients of the PDs, who have no obligation to agree to create or redeem Units on behalf of any investor and may impose terms and conditions in connection with such creation or redemption orders. Please refer to the Prospectus of the ETF for more details.
Investments are subject to investment risks including the possible loss of the principal amount invested, and are not obligations of, deposits in, guaranteed or insured by PCM or any of its subsidiaries, associates, affiliates or PDs. The value of the units and the income accruing to the units may fall or rise. Past performance is not necessarily indicative of the future or likely performance of the Products. There can be no assurance that investment objectives will be achieved. Any use of financial derivative instruments will be for hedging and/or for efficient portfolio management. PCM reserves the discretion to determine if currency exposure should be hedged actively, passively or not at all, in the best interest of the Products. The regular dividend distributions, out of either income and/or capital, are not guaranteed and subject to PCM’s discretion. Past payout yields and payments do not represent future payout yields and payments. Such dividend distributions will reduce the available capital for reinvestment and may result in an immediate decrease in the net asset value (“NAV”) of the Products. Please refer to <www.phillipfunds.com> for more information in relation to the dividend distributions.
The information provided herein may be obtained or compiled from public and/or third party sources that PCM has no reason to believe are unreliable. Any opinion or view herein is an expression of belief of the individual author or the indicated source (as applicable) only. PCM makes no representation or warranty that such information is accurate, complete, verified or should be relied upon as such. The information does not constitute, and should not be used as a substitute for tax, legal or investment advice.
The information herein are not for any person in any jurisdiction or country where such distribution or availability for use would contravene any applicable law or regulation or would subject PCM to any registration or licensing requirement in such jurisdiction or country. The Products is not offered to U.S. Persons. PhillipCapital Group of Companies, including PCM, their affiliates and/or their officers, directors and/or employees may own or have positions in the Products. This advertisement has not been reviewed by the Monetary Authority of Singapore.