
Market Commentary – July 2024
Equity Market Update:
Source: Bloomberg
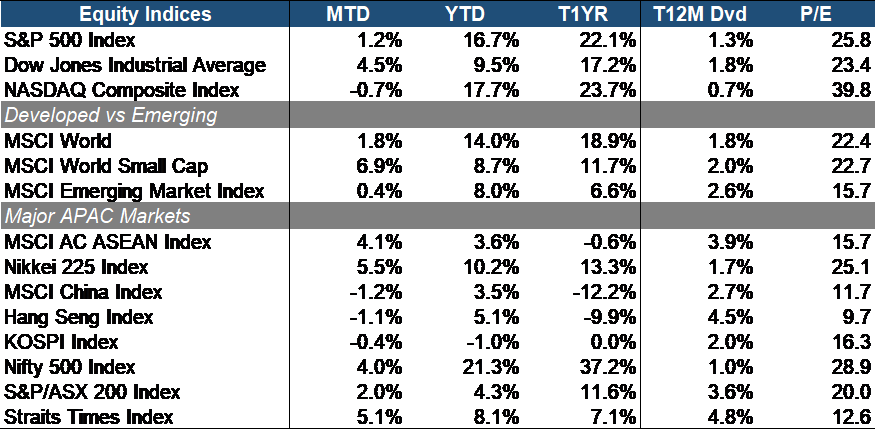
The equity market displayed mixed results in July, with investors gravitating towards value stocks. The DJIA (+4.5% MTD) outperformed the growth-oriented NASDAQ Composite (-0.7% MTD), while the S&P 500 (+1.2% MTD) continued its upward momentum on a month-over-month basis.
Developed market equities (+1.8% MTD) outperformed emerging markets (+0.4% MTD), widening their year-to-date lead by approximately 5.3%. A sector rotation appears underway, with investors selling off large caps (+1.8% MTD) in favor of small-cap stocks (+6.9% MTD). This was driven by mounting anticipation of a potential rate cut in September.
APAC equities had varied results, but ASEAN equities (+4.1% MTD) outperformed their U.S. counterparts, with Japan (+5.5% MTD) and Singapore (+5.1% MTD) leading the region. Conversely, Chinese (-1.9% MTD) and Hong Kong (-0.9% MTD) equities were the worst-performing major APAC markets.
 Source: Bloomberg
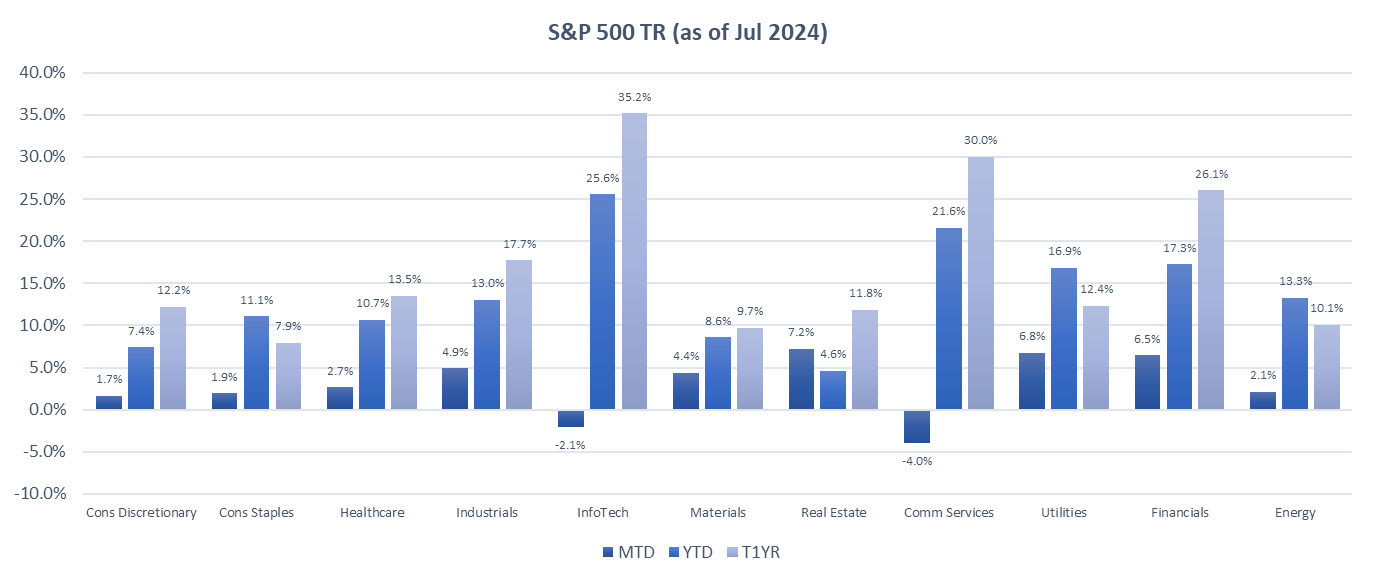
The S&P 500 sectors have exhibited mostly positive performance, with notable divergences between growth and defensive sectors. The growth and cyclical sectors, specifically Communication Services (-4.0% MTD), InfoTech (-2.1% MTD), and Consumer Discretionary (+1.7% MTD), were among the worst performers. The underperformance in these sectors was primarily driven by a weak job data report released at the end of July, which heightened recession fears and triggered a sell-off among growth stocks.
Conversely, defensive sectors demonstrated strong performance. Utilities (+6.8% MTD) led the gains, benefiting from their perceived safety in times of economic uncertainty. Other defensive sectors that thrived included Real Estate (+7.2% MTD) and Financials (+6.5% MTD), both of which are expected to benefit from the expected interest rate cuts in September.
 Source: Bloomberg
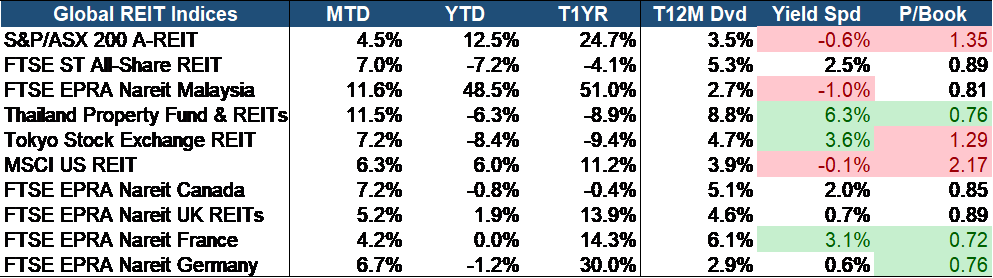
In July, global REIT markets experienced positive stock performance across the board with Malaysia (+11.6% MTD) and Thailand (+11.5% MTD) led the gains. SREITs (+7.0% MTD) also posted strong performance with a yield spread that remains highly attractive on a global scale, standing at 2.5%. Challenges such as persistent inflation and policy tightening have impacted SREITs’ distributions so far this year. However, our medium-to-long-term outlook for the sector remains positive due to the high quality of the underlying assets, providing a solid foundation for sustained performance.
Additionally, SREITs are currently undervalued, with a Price-to-Book ratio of 0.89 that lies significantly below historical averages. This valuation gap, on top of the attractive yield, presents a potential opportunity for investors seeking value appreciation and income. The combination of high-quality assets, attractive yields, and undervalued valuations positions SREITs favorably in the current economic environment.
Equity Market Outlook:
 Source: Bloomberg
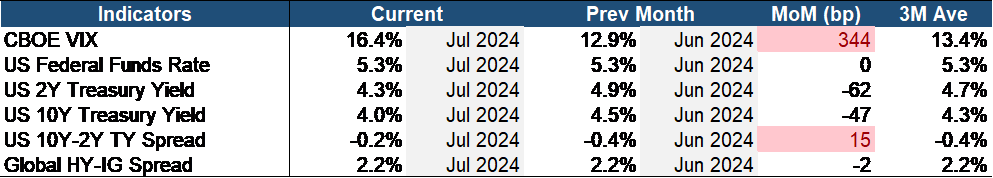
The stock market turned risk-off in July, with the VIX surging by 344 basis points month-over-month, exceeding its three-month average. The yield curve remained inverted, highlighting growing economic concerns. Investor caution was evident, particularly with the notable higher drop in the 2-year (short-term) Treasury yield when compared to the 10-year. Despite these signs of increased risk aversion, the credit spread between High Yield and investment-grade bonds remained stable, indicating no significant change in corporate bond market risk perception.
Source: Bloomberg
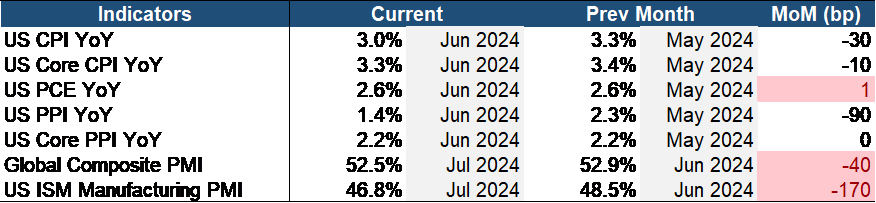
Recent economic data has been largely positive, bolstering the equity market rally. Inflation metrics, including both the headline and core Consumer Price Index (CPI) and the Personal Consumption Expenditures (PCE) index, have shown month-over-month declines, indicating moderation. The PCE index, closely watched by the Fed, offers a favorable signal for the equity market. However, the rise in the headline Producer Price Index (PPI), despite a stable core PPI, suggests persistent inflationary pressures, as PPI often acts as an early indicator for broader inflation trends.
Additionally, both US and Global composite PMIs have contracted month-over-month, raising concerns that the recent rate cut might have been too late to prevent a rapidly cooling economy. This contraction, in addition to the weak job report data, has prompted a noticeable shift in market sentiment, with investors moving from growth stocks to more stable, income-generating defensive sectors. This shift underscores growing concerns over economic stability and the potential for a recession, as evidenced by the market’s cautious reaction to economic indicators signaling a potential slowdown.
Looking ahead, we anticipate continued positive earnings in the second half of 2024. According to FactSet, of the 75% of S&P 500 companies that have reported their Q2 2024 results, approximately 78% have posted positive EPS surprises, while 59% have exceeded revenue expectations. The recent market sell-off might present a buying opportunity as it is potentially an overreaction to the slowdown effect that should have happened earlier when the biggest & fastest interest rate hike in a generation had not crashed the economy. Cooling inflation, coupled with the recent weak job report, increases the likelihood of upcoming rate cuts, which would further support equities in the long run.
We are optimistic about small caps moving forward but remain cautious about completely favoring them over large caps due to ongoing market uncertainty. Big techs, with their robust cash flow generation and substantial reserves, are well-positioned to weather economic downturns. Their minimal reliance on external borrowing for growth further enhances their defensive appeal, especially if interest rates remain elevated for an extended period. Historically, tech stocks have also performed well in low-interest-rate environments, which could be beneficial if the Fed begins to cut its benchmark rate aggressively.
Moreover, the transformative impact of AI on earnings is just beginning. We are optimistic about AI’s potential to boost productivity in early-adopting sectors, which could reduce unit labor cost inflation and potentially lower core inflation below market expectations. This evolving landscape supports a positive long-term outlook for large-cap tech stocks.
China Market Update:
The overall trend for the Shanghai Composite and Shenzhen Component exhibited moderate growth in the month of July. Many companies reported strong quarterly earnings, particularly in the tech and consumer sectors, which led to a rise in their stock prices. Technology and consumer discretionary sectors outperformed, driven by government support for innovation and improved consumer spending. Conversely, traditional industries like manufacturing faced headwinds from slower global demand.
The Caixin/S&P Global services purchasing managers’ index (PMI) rose to 52.1 from 51.2 in June, pointing to expansion for the 19th straight month. The index covers mostly private and export-oriented companies and the 50-mark separates expansion from contraction on a monthly basis. In contrast, the official services PMI showed the sector stalling in July from growth in June, with retail sales, capital market services, and real estate service industries all shrinking.
The Third Plenary which was conveyed from 15-18 July emphasized economic reforms and support for green technology. The key details are as follows
- Economic Reforms: The Pro-private sector reforms encourage private participation in key sectors including fiscal and tax reforms, financial reform, and social welfare reforms.
- Technology and Innovation: There was a strong push on new generation sectors like IT, AI, aerospace, renewable energy, and high-end equipment manufacturing.
- Green Transition: The focus on green development with commitments to reduce carbon emissions.
These announcement boosts investor confidence and positive for stocks in Technology, green energy, and consumer goods.
Overall, we saw positive economic indicators like steady GDP growth and improved industrial output which boosted investor confidence. The enhanced consumer spending also supported market performance. Premier Li Qiang highlighted at the World Economic Forum the growth of new industries as a pillar of China’s economic development. This is evident in the official PMI for high-tech manufacturing, which rose to 52.3 in June from 50.7 in May, reflecting increased investment in advanced sectors like computer chips and electric vehicles.
Looking forward, economists and investors are anticipating the Third Plenum scheduled for July 15-18, where top Communist Party officials will convene in Beijing for strategic planning.
Despite current challenges, we maintain optimism about China’s economic outlook, expecting government stimulus measures and necessary market adjustments to support future growth.
Fixed Income Update:
Source: Bloomberg
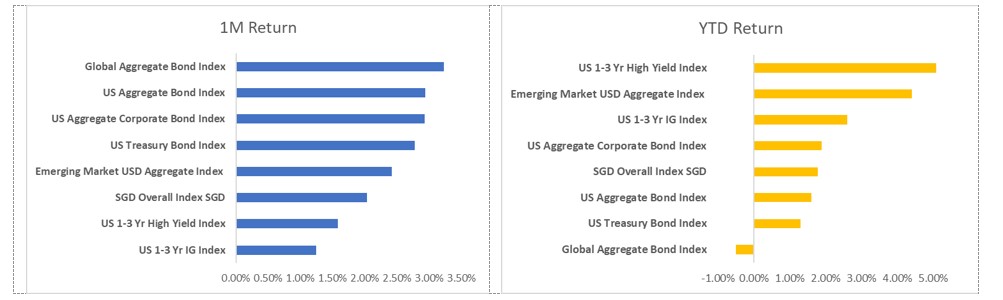
The month of July saw strong gains for major bond market indices led by the Global Aggregate Bond Index which advanced 3.23% on a 1M basis while short-duration bonds as represented by the US 1-3 Year IG Index the laggard returning 1.25%. This strong performance in bonds in July means that on a YTD basis, returns across most of these indices are now in positive territory except the Global Aggregate Bond Index which is still slightly negative at -0.5%.
The strong returns in the bond market in July also come on the back of a faltering stock market with the Nasdaq down 2.3% and the S&P500 eking out a mere 0.86% return on the month. This outperformance in bonds may be the result of a continuation of what we highlighted in last month’s commentary about the market’s growing expectations of an imminent rate cut from the FED along with further policy easing from other major central banks. During the July FOMC meeting, Powell delivered exactly what the markets were expecting, holding rates steady but signaling the possibility of a 25bps cut as soon as the September meeting; what has been dubbed by some bond market participants as a “dovish hold.”
However, it is important to note as well that leading up to the FOMC several prominent voices such as Chief Economic Advisor of Allianz Mohammed El-Erian and former Federal Reserve Bank of New York President Bill Dudley had urged Powell to move quicker and cut rates in July itself.
Beware the Bull Steepener
In light of the impending rate cut by the FED, it may also be instructive for us to pay attention to how the US Treasury yield curve has been reacting recently for additional clues on the macroeconomic outlook in the US. Over the past year what we have witnessed is a “bull steepening” effect. This is when the front end of the yield curve falls at a faster rate than the long end.
For example, exactly one year ago, the US 2-year treasury yield was trading at about 4.8% while it currently trades at about 4.2%. The 10-year yield on the other hand finds itself trading at about the same level as it was a year ago at about 4%. In other words, we have gone from an almost -80bps inversion to what is now closer to a -20bps inversion between the 2- and 10-year yields. This “un-inverting” process historically has been the bond market’s early warning sign of a fast-approaching recession.
Such moves across the yield curve come at a time of great confusion in the markets surrounding the actual strength of the US economy and labor market with viewpoints diverging across Wall Street economists and analysts alike. Just as recent as June, many on Wall Street were hailing the exceptionally strong US economy which was expected to expand by 2.5% in 2024 while inflation also continued to trend downwards – the much-anticipated soft landing scenario that the FED had painstakingly engineered. Some had even gone so far as to suggest that the yield curve was an outdated indicator that was no longer fit for purpose. However, it is becoming increasingly evident that bad news is brewing.
From the corporate earnings standpoint, we have had a slew of bad reports for Q2 24 from automakers such as Ford to luxury names such as LVMH who claimed that its wine business took a 12% topline hit because people were “too sad” to buy champagne! And it’s not just the luxury consumer who is showing signs of strain. Even consumer staples mainstays such as Proctor & Gamble and PepsiCo announced a weak set of earnings and warned of a weak consumer who is becoming increasingly budget-focused.
The labour market is also showing signs of deterioration with the Sahm rule[1], a key recession indicator, close to being triggered as of this writing at the end of July.
In the end, it may be wise for us to take our cues from what the yield curve is telling us which is that the US economy is likely much weaker than what the market perceives, and prepare accordingly.
BOJ delivers rate hike, signals tapering of bond purchase program
Following a policy meeting on July 31st, the Bank of Japan raised its overnight call rate to 0.25%, the highest level it has been since 2008. The surprise move sent tremors across financial markets with the Yen surging to its strongest level against the greenback since March and causing many investors to reassess the viability of the infamous Yen carry trade. The rate hike also sent the Japanese Nikkei tumbling in its aftermath. The BOJ also reaffirmed its plan to commence tapering its government bond-buying program and shrink the size of its balance sheet. BOJ Governor Kazuo Ueda has also not ruled out the possibility of another rate hike later in the year.
Though Japanese equities were hit badly across the board, the bank stocks took it especially hard on the chin with the Topix bank index plunging 11%. The fear with Japanese financials is the huge paper losses that may be incurred on their JGB holdings though there is evidence from our own analysis that the banks have moved in the prior quarters to reduce duration on their balance sheet ahead of the BOJ tightening cycle. This means that the outsized moves in the share price of Japanese bank stocks relative to other Japanese equities may be drastic and hopefully short-lived. It will also be key to monitor how Japanese bank spreads and net interest margin (NIM) react in the coming quarters with the gradual drift upwards in deposit rates.
JP Morgan Includes India Bonds in Emerging Market Index
Shifting away from developed markets, there has been a significant development in the emerging market bond space. On June 28 2024, Indian Government Bonds (IGB) were included in the JP Morgan Emerging Markets Bond Index (EMBI). This move could see a flood of foreign capital inflow into India’s tightly regulated sovereign debt market. The IGBs will begin to be included in the index, with just a 1% weight initially though this proportion will increase by one percentage point each month until it reaches a cap of 10 percent by March 31, 2025.
Many have hailed the inclusion as a huge step in liberalizing India’s capital markets and even a prelude to India bonds being included in larger global bond indices such as FTSE Russell’s World Government Bond Index or Bloomberg’s Global Aggregate Index. It is hoped that the foreign inflows will help reduce the government’s dependence on domestic investors and lower interest rates in the nation. Others have also cautioned that this move could act as a double-edged sword increasing volatility in interest rates and the Indian Rupee which will now be subject to more hot capital inflows and outflows.
Interestingly we note that for the month of July, EMBI returned 2.7% which slightly outperformed its Bloomberg emerging market index counterpart as tracked above which only returned 2.41%. It will be interesting to observe in the coming months if exposure to India bonds results in sustained outperformance for the EMBIG CORE index over other emerging market indices.
[1]The Sahm Rule indicates that the economy is in a recession when the three-month moving average of the national unemployment rate exceeds the lowest three-month moving average unemployment rate from the previous 12 months by half a percentage point or more (Source: economictimes.com)
Important Information
This material is provided by Phillip Capital Management (S) Ltd (“PCM”) for general information only and does not constitute a recommendation, an offer to sell, or a solicitation of any offer to invest in any of the exchange-traded fund (“ETF”) or the unit trust (“Products”) mentioned herein. It does not have any regard to your specific investment objectives, financial situation and any of your particular needs. You should read the Prospectus and the accompanying Product Highlights Sheet (“PHS”) for key features, key risks and other important information of the Products and obtain advice from a financial adviser (“FA“) before making a commitment to invest in the Products. In the event that you choose not to obtain advice from a FA, you should assess whether the Products are suitable for you before proceeding to invest. A copy of the Prospectus and PHS are available from PCM, any of its Participating Dealers (“PDs“) for the ETF, or any of its authorised distributors for the unit trust managed by PCM.
An ETF is not like a typical unit trust as the units of the ETF (the “Units“) are to be listed and traded like any share on the Singapore Exchange Securities Trading Limited (“SGX-ST”). Listing on the SGX-ST does not guarantee a liquid market for the Units which may be traded at prices above or below its NAV or may be suspended or delisted. Investors may buy or sell the Units on SGX-ST when it is listed. Investors cannot create or redeem Units directly with PCM and have no rights to request PCM to redeem or purchase their Units. Creation and redemption of Units are through PDs if investors are clients of the PDs, who have no obligation to agree to create or redeem Units on behalf of any investor and may impose terms and conditions in connection with such creation or redemption orders. Please refer to the Prospectus of the ETF for more details.
Investments are subject to investment risks including the possible loss of the principal amount invested, and are not obligations of, deposits in, guaranteed or insured by PCM or any of its subsidiaries, associates, affiliates or PDs. The value of the units and the income accruing to the units may fall or rise. Past performance is not necessarily indicative of the future or likely performance of the Products. There can be no assurance that investment objectives will be achieved. Any use of financial derivative instruments will be for hedging and/or for efficient portfolio management. PCM reserves the discretion to determine if currency exposure should be hedged actively, passively or not at all, in the best interest of the Products. The regular dividend distributions, out of either income and/or capital, are not guaranteed and subject to PCM’s discretion. Past payout yields and payments do not represent future payout yields and payments. Such dividend distributions will reduce the available capital for reinvestment and may result in an immediate decrease in the net asset value (“NAV”) of the Products. Please refer to <www.phillipfunds.com> for more information in relation to the dividend distributions.
The information provided herein may be obtained or compiled from public and/or third party sources that PCM has no reason to believe are unreliable. Any opinion or view herein is an expression of belief of the individual author or the indicated source (as applicable) only. PCM makes no representation or warranty that such information is accurate, complete, verified or should be relied upon as such. The information does not constitute, and should not be used as a substitute for tax, legal or investment advice.
The information herein are not for any person in any jurisdiction or country where such distribution or availability for use would contravene any applicable law or regulation or would subject PCM to any registration or licensing requirement in such jurisdiction or country. The Products is not offered to U.S. Persons. PhillipCapital Group of Companies, including PCM, their affiliates and/or their officers, directors and/or employees may own or have positions in the Products. This advertisement has not been reviewed by the Monetary Authority of Singapore.