
Market Commentary – January 2025
EQUITY MARKET UPDATE
Source: Bloomberg.
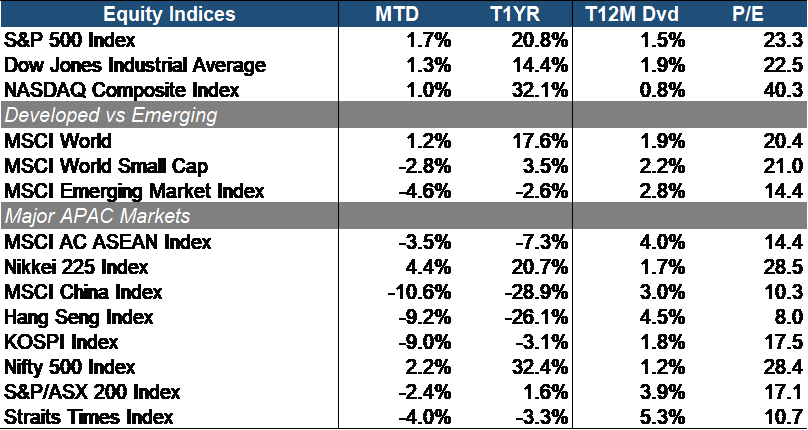
The equity market posted a modest gain in the first month of the year, with the S&P 500 rising 1.7% month-to-date (MTD). Growth slightly lagged value, as the Dow Jones Industrial Average (+1.3% MTD) outperformed the NASDAQ Composite (+1.0% MTD). The return of President Trump to the White House was received positively by US equities, but investor sentiment wavered following the emergence of Chinese AI tech DeepSeek, raising concerns about excessive optimism surrounding leading US AI stocks.
Developed markets remained resilient, with the MSCI World Index advancing 1.2% MTD, significantly outperforming the MSCI Emerging Markets Index (-4.6% MTD). Small caps (-2.8% MTD) continued to lag, reflecting investor caution amid mixed economic signals that heightened the probability of a pause in the Federal Reserve’s rate cuts.
Across APAC, most ASEAN markets underperformed their Western counterparts, except for Japan (+4.4% MTD) and India (+2.2% MTD). Japan remained strong, supported by robust corporate earnings as the country transitioned from a deflationary economy to a growth-driven one. Meanwhile, Chinese equities (-10.6% MTD) were the weakest performers, as trade tensions with the US weighed on the yuan and broader market sentiment.
 Source: Bloomberg.
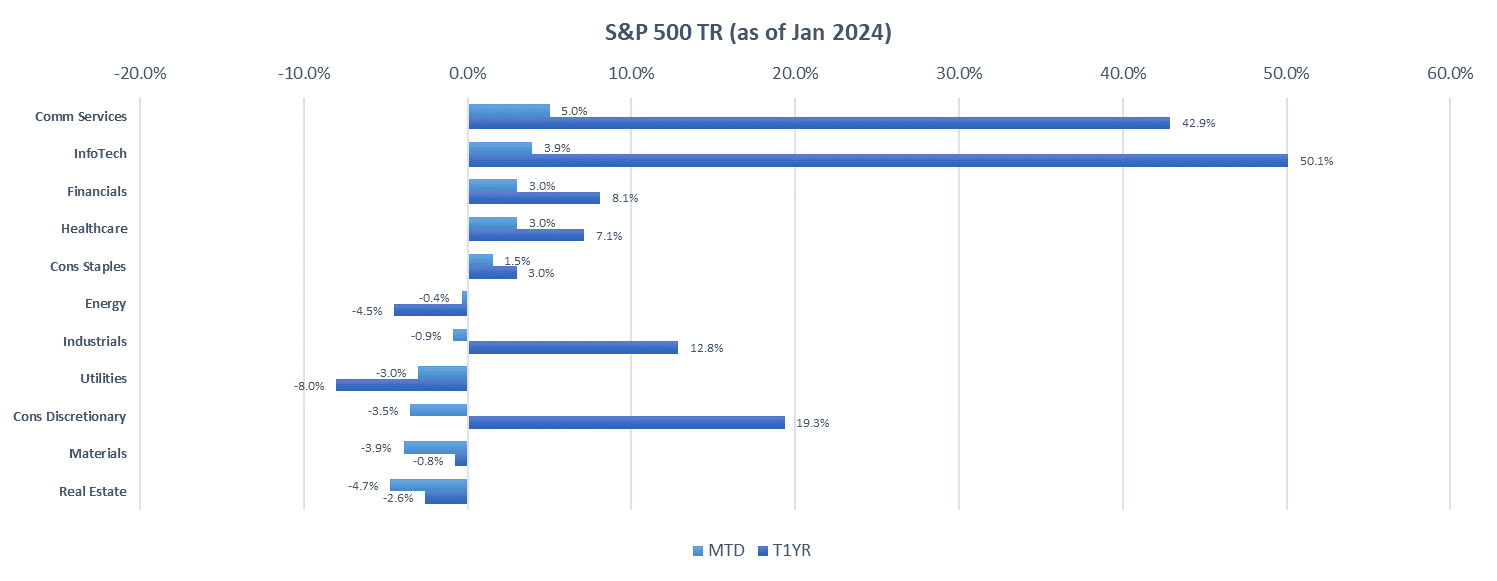
The S&P 500 sectors reported a mixed performance in January 2025, with growth-driven sectors leading the gains. Communication Services (+5.0% MTD), Information Technology (+3.9% MTD), and Financials (+3.0% MTD) were the top performers, supported by monetary policy easing, strong earnings from key players, and alignment with long-term growth drivers such as AI, semiconductors, and digital innovation. Financials, in particular, benefited from stronger-than-expected economic growth, expectations of deregulation under the Trump administration, attractive valuations, and lower interest rates.
On the other hand, Real Estate (-4.7% MTD), Materials (-3.9% MTD), and Consumer Discretionary (-3.5% MTD) were the weakest-performing sectors. Real Estate lost momentum in December, surrendering most of its gains for the year, as concerns over a potential pause in rate cuts weighed on the sector. Meanwhile, global economic uncertainty dampened demand for commodities and materials, which tend to struggle during periods of economic slowdown.
Source: Bloomberg.
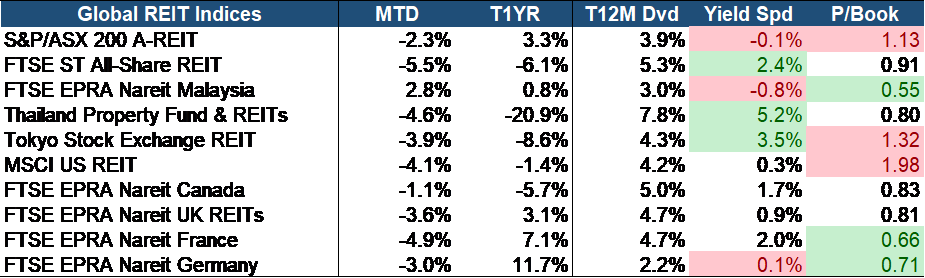
The global REIT market faced continued headwinds in January, as the prospect of a higher-for-longer interest rate environment dampened investor sentiment. Most global REITs ended the month in negative territory, with the exception of Malaysian REITs (+2.8% MTD). The sector as a whole was the weakest performer, with REITs declining 5.5% MTD, reflecting concerns over rising borrowing costs and cap rate adjustments.
Despite near-term challenges, including elevated financing costs and pressure on valuations, our medium-to-long-term outlook for the REIT sector remains constructive, supported by the high quality of underlying assets. SREITs, in particular, offer a globally competitive yield spread of 2.9%, ranking third behind Thailand and Japan. Valuations are also compelling, with the sector trading at a Price-to-Book ratio of 0.86 which is well below historical averages and presents an attractive opportunity for investors seeking both value appreciation and stable income.
We continue to favor resilient and recession-proof subsectors such as Industrial and Data Centers, which are well-positioned to withstand economic uncertainties and drive long-term growth. Additionally, Singapore-focused Retail and Grade-A Office players stand to benefit from resilient domestic demand, a constrained supply pipeline over the next 3-5 years, and potential re-rating opportunities due to current valuation mispricing.
EQUITY MARKET OUTLOOK
 Source: Bloomberg.
The stock market adopted a more risk-off stance, as reflected in a sharp 143 bps MoM rise in the VIX, surpassing its three-month average. Meanwhile, the yield curve re-entered inversion territory, signaling growing investor skepticism about the near-term economic outlook. Additionally, the slight widening of credit spreads suggests a weakening risk appetite in the corporate bond market.
Source: Bloomberg.
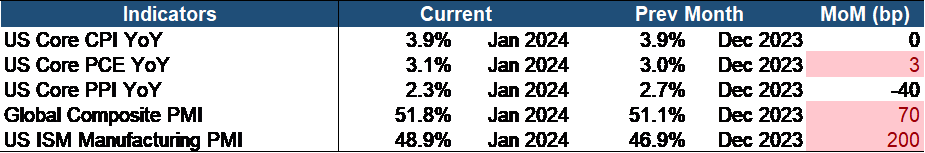
The current economic landscape presents both challenges and opportunities. Inflation remains persistent, with core CPI unchanged and the Personal Consumption Expenditures (PCE) index, a key metric for the Federal Reserve, rising to 3.1%, well above the 2% target. However, signs of easing pressures emerged, including a 40-bps decline in the core Producer Price Index (PPI) and a modest uptick in the manufacturing index.
Despite near-term headwinds, we maintain a positive outlook for equities, as opportunities are expected to outweigh risks. However, investors must navigate a prolonged higher-rate environment, driven by persistent inflationary pressures and resilient economic growth. US GDP expanded at a robust 2.8% year-over-year in Q3 2024, fueled by strong consumer spending and income growth. Inflation risks could intensify if President-elect Trump’s proposed tariffs take effect, adding further upward pressure on prices. Meanwhile, geopolitical instability remains a key risk, potentially triggering a flight to safety. However, its impact is likely to be region-specific, with select sectors—such as Aerospace and Defense—standing to benefit. Notably, Trump has expressed a willingness to de-escalate global conflicts, starting with the war in Ukraine.
On the opportunity front, a significant amount of capital remains on the sidelines, with approximately $7 trillion in money market funds ready to rotate into equities. Corporate fundamentals remain strong, as evidenced by Q3 earnings results—75% of S&P 500 companies exceeded EPS expectations, while 61% surpassed revenue estimates. Market breadth is also improving, with small-cap stocks poised to gain traction as their earnings growth outpaces that of large-caps. Declining interest rates will further enhance their appeal by lowering funding costs and improving long-term earnings prospects. Additionally, Trump’s pro-growth policies could provide an added boost, particularly for small caps, which generate a lower share of revenue from international markets and may gain a competitive edge if trade barriers are implemented.
However, it would be premature to overlook Big Tech in this environment. Given ongoing economic uncertainties, market sentiment could shift quickly, reinforcing the defensive appeal of large-cap technology firms. These companies boast strong cash flows and significant cash reserves, enabling them to weather economic downturns with minimal reliance on external borrowing. Historically, Big Tech has also performed well in lower-rate environments, positioning them to benefit as the Federal Reserve eventually moves toward policy easing. Moreover, these firms remain at the forefront of artificial intelligence (AI) investment, poised to capitalize on its transformative potential. The AI-driven rally is expanding, with growing optimism about its ability to drive productivity gains across industries. By reducing unit labor costs, AI adoption could accelerate disinflation, potentially bringing core inflation down faster than current market projections. As the full impact of AI innovation on corporate earnings is only beginning to unfold, we remain optimistic about its long-term ability to reshape industries and fuel sustained growth.
CHINA MARKET UPDATE
China’s economy grew by 5% in 2024 meeting the government target but below 5.2% GDP growth in 2023. It achieved its target on back of surging manufacturing, front loaded exports in anticipation of higher US tariffs and better stimulus efforts. The economist expectations were slightly below at 4.9%. The strong exports and manufacturing are offsetting weak household spending and sentiment. Retail sales grew by 3.5% in 2024 as consumer confidence remained weak while industrial output rose by 5.8% due to strong growth in manufacturing. Residential property prices fell in large cities except for new home rises in Shanghai. China markets have turned interested in Trump imposing tariffs on China and Deepseek announcement.
US President Donald Trump imposed major tariffs on China, Mexico, and China of 10%, 25% and 25% respectively. China also retaliated and imposed tariffs on select US goods. The impact of these tariffs is expected to be mitigated by the fiscal stimulus to be unveiled in March. The fiscal stimulus is expected to exceed RMB10tn (7.4% of GDP) which can easily mitigate the tariff loss of 0.3-.6% of GDP. Chinese manufacturers are less exposed to US trade restrictions compared to the last trade war as the US accounted for 19.3% in 2018 compared to 14.7% of good exports last year. While the Chinese exporters are less reliant on US demand but the US has grown highly reliant on Chinese factories, especially in areas of smartphones, laptops, and video game consoles. China is well prepared for these trade tariffs.
China announced a new open-source AI infrastructure services called DeepSeek which will accelerate AI adoption as AI input cost is reduced. There is an increase in interest in AI-related investment opportunities in areas like Cloud platforms, Application Software, Edge devices, Electronic Components, Semiconductors, and vertical applications like BABA, Tencent, Kingdee , Xiaomi, etc
While the Chinese market turned weak post the US-China trade tensions, we believe the market is likely to shift its focus on the NPC (National People’s Congress) in the annual session in Beijing on 5th March 2025. The NPC stimulus is expected to be much larger than the economic impact of the trade war.
FIXED INCOME UPDATE
Source: Bloomberg; Returns are presented in USD terms
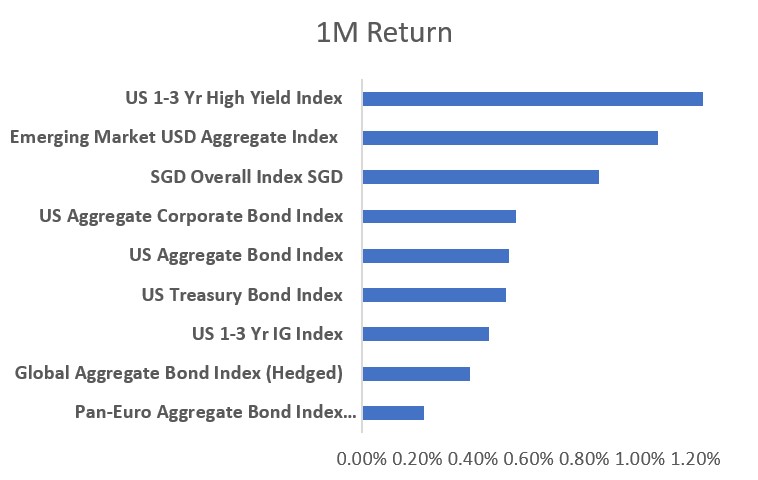
Fixed income is off to a decent start in 2025, with all the major bond market indices being tracked, ending the month with gains. Returns, however, were generally muted across the board. The US high yield index led the way, up 1.23% in January, while the European bond index was the laggard on the month, advancing a mere 0.24%.
The first half of January saw the US 10-year treasury yield rise from about 4.5% to 4.8% due to rising inflation expectations and concerns about the unsustainable US fiscal trajectory. A better-than-expected inflation print caused it to sink back to about 4.6%. Towards the end of the month, a FED decision to hold interest rates and a weaker-than-expected GDP print resulted in the 10-year yield settling at about 4.55%.
As of 2024, US high-yield and emerging market bonds continue outperforming the other major bond indices in January 2025. However, from now on, we will be more cautious about these two sub-asset classes. Despite the elevated all-in yields on offer for high-yield bonds, their rich valuations pose a potential risk as there is unlikely to be much more upside from further spread compression. As for emerging market bonds, careful credit selection would be key as we enter a period of heightened global trade risks.
Tariffs and Turbulence: Navigating the Impact of Trump’s Trade Policies
The Trump administration’s recent tariffs on Canada, Mexico, and China spiked volatility across financial markets. The bond market’s initial reaction was a perception that the Federal Reserve would maintain high rates for longer, expecting slower long-term growth. This resulted in a flattening US treasury yield curve with rising short-term yields and falling long-term yields. The Canadian Dollar plunged to levels not seen since the pandemic following the imposition of 25% tariffs on Canadian goods. At the same time, the Mexican Peso and Chinese Yuan also depreciated against the greenback.
Source: CEIC,HSBC
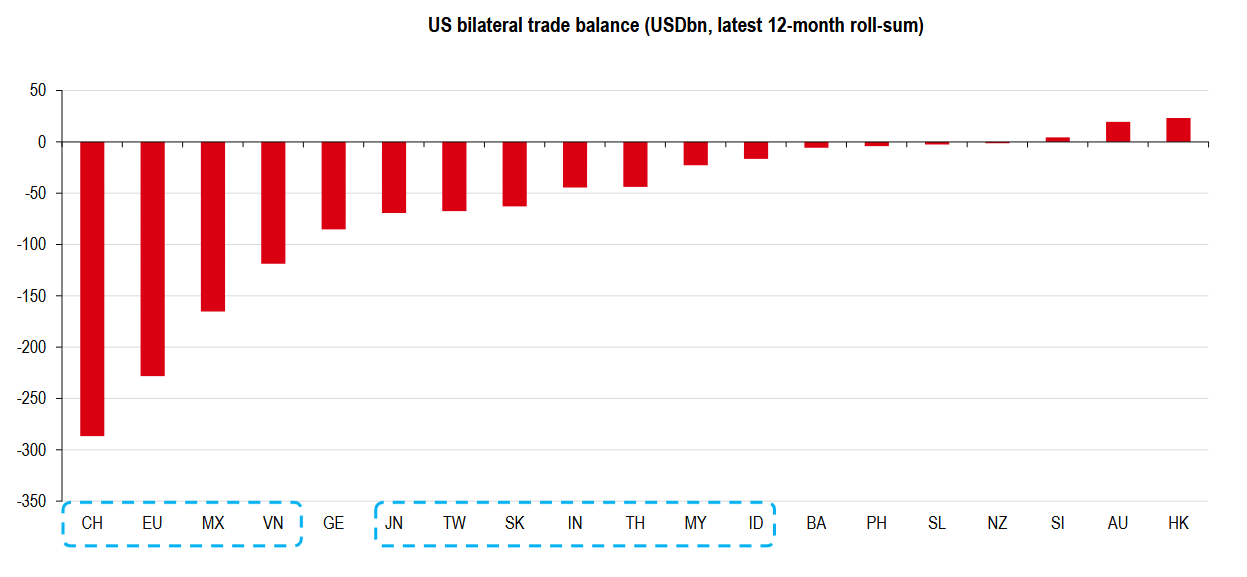
Figure 1. Chart on US bilateral trade balance
While Canada, Mexico, and China dominated the news stream, the chart in Fig 1. demonstrates that the EU, Vietnam, and other Southeast Asian countries could soon be in the Trump administration’s crosshairs concerning trade policy due to sizeable trade deficits they are running with the US. Trump had also warned of similar measures that could be imposed on the EU. The tariff announcement sent European bond yields in the UK, Germany, and France falling, with investors likely adding to bets on further rate cuts by the BOE and ECB due to the hit to economic growth that tariffs would likely have on the Eurozone.
Elsewhere in Asia, the chart in Fig 2. below further illustrates that many South East Asian economies such as Vietnam, Singapore, Thailand, and Malaysia may be the most vulnerable economically to any tariff threats since their export exposure to the US as a percentage of GDP is sizeable. This could lead to a considerable deterioration in credit fundamentals for corporates in such countries. Interestingly, even though China often comes up in discussions about tariffs, Fig 2. highlights that their export exposure to the US being under 5% means that the impact of tariffs on the Chinese economy may not be as sizeable as the market expects and may fall more disproportionately on a country such as Vietnam which is not often spoken about.

Source: OECD, HSBC
Figure 2. The chart on export importance to China and various other nations as a % of GDP
As of this writing, the Trump administration has agreed to a 30-day pause on tariffs on Canada and Mexico after both nations pledged to beef up border enforcement. In the coming months, we will need to monitor the impact of tariffs on global trade and economic stability closely, focusing on their impact on European and Asian corporate credit fundamentals.
SGD Credit and Yield Outlook for 2025
With 2025 setting up to be a highly volatile year for global markets due to President Trump’s tariff policies and geopolitical risks, let us hone in on our home market of Singapore and discuss the Singapore dollar credit and yield outlook for the year ahead.
At a high level, with the Fed expected to adopt a cautious stance on further rate cuts and MAS possibly easing slightly, both global and local interest rates are likely to remain low but relatively stable. The global economic environment remains volatile due to inflation risks and geopolitical uncertainties, but Singapore’s political stability and MAS’s policy approach should stand as a bulwark and make SGD assets, including money market instruments and bonds attractive.
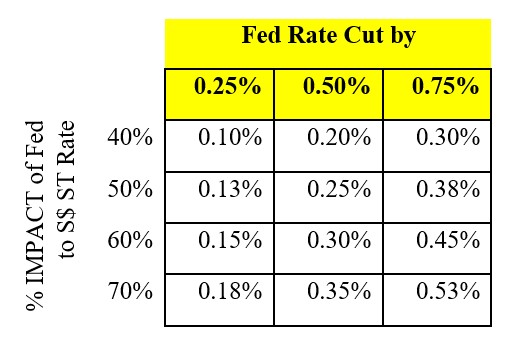
In 2025, we expect SGD SORA OIS rates to have a lower pass-through (40%-70%) compared to USD rates. This means that global interest rate changes, especially those in the U.S., will have a reduced impact on Singapore bond yields, providing some stability for SGD-denominated assets. To illustrate this point, the table below projects the impact of FED rate cuts on Singapore’s short-term (S$ ST) rates, depending on how much the Fed reduces its rates. The table suggests that the percentage change in the S$ ST rate varies depending on the size of the Fed rate cut and the corresponding impact (40%, 50%, 60%, or 70%).
For example:
- A 0.25% Fed rate cut would have a 0.10% to 0.18% impact on Singapore’s short-term rate, depending on the sensitivity (40% to 70%).
- A 0.50% cut would have a 0.20% to 0.35% impact.
- A 0.75% cut would have an impact between 0.30% to 0.53%.
With a forecast like this, we are gradually extending weighted average maturities (WAM) from 40days+ to 90 days for our money market funds to optimise returns in the context of a normalizing yield curve. For our bond funds we will adopt a maturity laddering strategy where we gradually and tactically extend duration whenever we see value. We will also continue to focus on investing in money market instruments and bonds from high quality issuers with strong credit fundamentals that can withstand a downturn in global economic conditions.
Important Information
This material is provided by Phillip Capital Management (S) Ltd (“PCM”) for general information only and does not constitute a recommendation, an offer to sell, or a solicitation of any offer to invest in any of the exchange-traded fund (“ETF”) or the unit trust (“Products”) mentioned herein. It does not have any regard to your specific investment objectives, financial situation and any of your particular needs. You should read the Prospectus and the accompanying Product Highlights Sheet (“PHS”) for key features, key risks and other important information of the Products and obtain advice from a financial adviser (“FA“) before making a commitment to invest in the Products. In the event that you choose not to obtain advice from a FA, you should assess whether the Products are suitable for you before proceeding to invest. A copy of the Prospectus and PHS are available from PCM, any of its Participating Dealers (“PDs“) for the ETF, or any of its authorised distributors for the unit trust managed by PCM.
An ETF is not like a typical unit trust as the units of the ETF (the “Units“) are to be listed and traded like any share on the Singapore Exchange Securities Trading Limited (“SGX-ST”). Listing on the SGX-ST does not guarantee a liquid market for the Units which may be traded at prices above or below its NAV or may be suspended or delisted. Investors may buy or sell the Units on SGX-ST when it is listed. Investors cannot create or redeem Units directly with PCM and have no rights to request PCM to redeem or purchase their Units. Creation and redemption of Units are through PDs if investors are clients of the PDs, who have no obligation to agree to create or redeem Units on behalf of any investor and may impose terms and conditions in connection with such creation or redemption orders. Please refer to the Prospectus of the ETF for more details.
Investments are subject to investment risks including the possible loss of the principal amount invested, and are not obligations of, deposits in, guaranteed or insured by PCM or any of its subsidiaries, associates, affiliates or PDs. The value of the units and the income accruing to the units may fall or rise. Past performance is not necessarily indicative of the future or likely performance of the Products. There can be no assurance that investment objectives will be achieved. Any use of financial derivative instruments will be for hedging and/or for efficient portfolio management. PCM reserves the discretion to determine if currency exposure should be hedged actively, passively or not at all, in the best interest of the Products. The regular dividend distributions, out of either income and/or capital, are not guaranteed and subject to PCM’s discretion. Past payout yields and payments do not represent future payout yields and payments. Such dividend distributions will reduce the available capital for reinvestment and may result in an immediate decrease in the net asset value (“NAV”) of the Products. Please refer to <www.phillipfunds.com> for more information in relation to the dividend distributions.
The information provided herein may be obtained or compiled from public and/or third party sources that PCM has no reason to believe are unreliable. Any opinion or view herein is an expression of belief of the individual author or the indicated source (as applicable) only. PCM makes no representation or warranty that such information is accurate, complete, verified or should be relied upon as such. The information does not constitute, and should not be used as a substitute for tax, legal or investment advice.
The information herein are not for any person in any jurisdiction or country where such distribution or availability for use would contravene any applicable law or regulation or would subject PCM to any registration or licensing requirement in such jurisdiction or country. The Products is not offered to U.S. Persons. PhillipCapital Group of Companies, including PCM, their affiliates and/or their officers, directors and/or employees may own or have positions in the Products. This advertisement has not been reviewed by the Monetary Authority of Singapore.