
Market Commentary – May 2025
EQUITY MARKET UPDATE
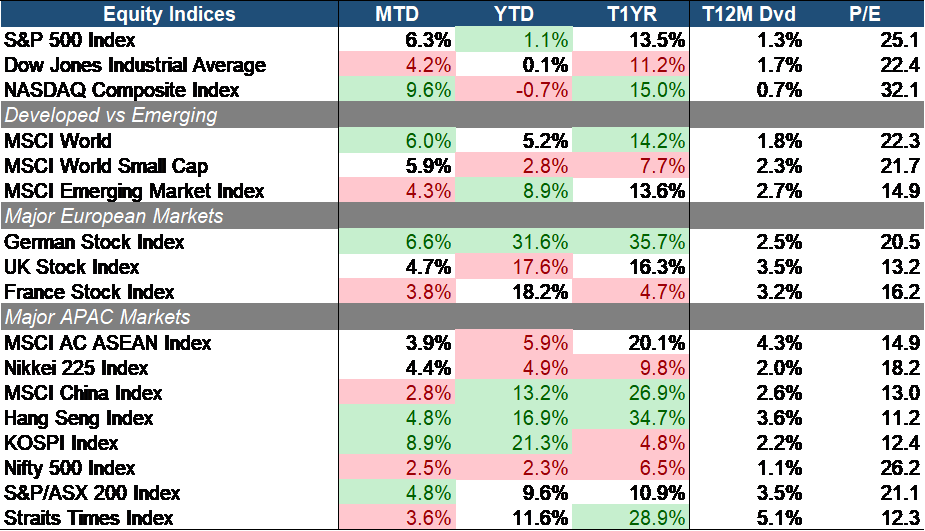
Source: Bloomberg (Total Return in USD terms)
The stock market rallied strongly by the end of May, recovering from April’s sell-off as investors turned optimistic on cooling inflation and a potential Fed rate cut later in the year. Strong jobs update (139k new payrolls, unemployment steady at 4.2%) and resilient consumer spending added to risk-on sentiment. Growth stocks led the rebound, with the NASDAQ Composite (+9.6% MTD) outperforming both the S&P 500 Index (+6.3% MTD) and Dow Jones Industrial Average (+4.2% MTD). Despite the NASDAQ’s strong May, it still lags slightly for this year (-0.7% YTD) due to April’s tech sell-off. That said, the overall US equity market has regained momentum, with AI-related names like NVIDIA driving the rally, supported by falling yields and a stable macro backdrop.
Developed market equities outperformed emerging markets in May. The MSCI World Index (+6.0% MTD) surged ahead of the MSCI Emerging Markets Index (+4.3% MTD), with the latter still maintaining a stronger YTD performance (+8.9% vs. +5.2%). Small caps (+5.9% MTD) also rebounded, reflecting renewed risk appetite across broader equity markets. The EM leadership this year was supported by the outflow of investors from US equities as a result from Trump Tariffs and the weakening of the Dollar.
European equities, particularly the German market (+6.6% MTD), continued to deliver robust returns, bolstered by improving industrial sentiment and moderating inflation data. UK (+4.7%) and France equities (+3.8%) also posted healthy gains, aided by strength in consumer discretionary and financials, as the ECB signaled potential policy support amid sluggish eurozone growth.
Most ASEAN markets and broader APAC indices continued their upward trend. The KOSPI Index (+8.9% MTD) led gains across Asia, driven by strong chip exports and expectations of improving global tech demand. Japan (+4.4%), Australia (+4.8%), and the MSCI AC ASEAN Index (+3.9%) also rose on supportive earnings and robust domestic activity. China (+2.8%) and Hong Kong (+4.8%) posted more moderate advances as investor caution lingered amid property sector overhang and deflationary pressures. Meanwhile, Singapore (+3.6% MTD) saw steady gains, helped by its high dividend yield and positioning as a stable financial hub in the region.
 Source: Bloomberg (Total Return in USD terms)
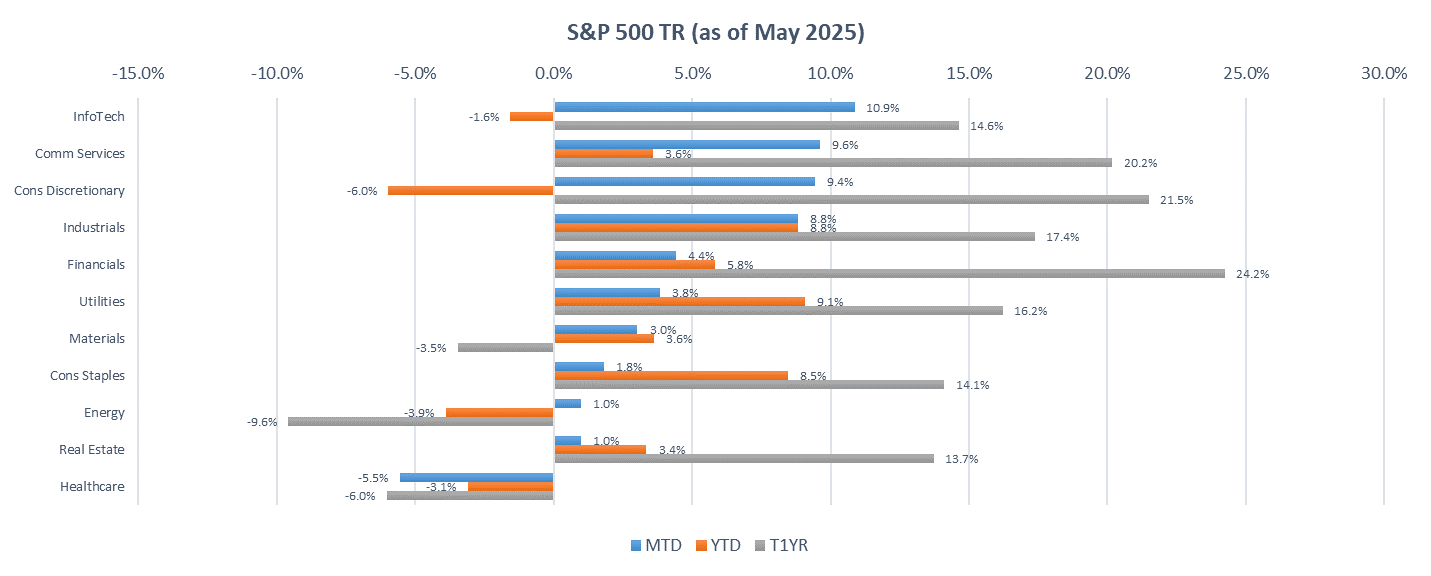
May’s market was characterized by strong rotation into growth and cyclical sectors, propelled by easing tariff risk, better-than-expected earnings, and confidence in an AI-fueled digital economy. Growth-oriented sectors such as Information Technology (+10.9% MTD) and Communication Services (+9.6% MTD) were leading under the support of strong AI and Cloud trend. Notably, tech powerhouse Oracle surged over 13% in May after delivering upbeat cloud and AI forecasts, while NVIDIA extended its rally following strong Q1 results, reinforcing the AI-led upside. Consumer Discretionary (+9.4% MTD) and Industrials (+8.8%) also rallied, likely fueled by reopening momentum, strength in housing and infrastructure, and cyclical optimism after May tariff truce signals. These sectors benefited from a rotation toward growth and cyclical exposures as fears of recession eased.
In contrast, Defensive sectors posted milder gains, while laggards like Energy (+1.0%), Materials (+3.0%), and Healthcare (–5.5%) lagged reflected ongoing headwinds tied to commodity prices, regulatory risks, and global manufacturing weakness. Energy remained under pressure due to weak oil prices and uncertainty over future fuel demand, even as U.S. renewables attracted renewed investor interest. Materials underperformed amid concerns over cyclicality and a slower global industrial outlook. Healthcare suffered the worst drop, dragged down by regulatory fears and a lack of take-away catalysts, despite a hiring surge in May, the strongest among all industries. Defensive sectors like Utilities (+3.8%), Consumer Staples (+1.8%), Financials (+4.4%), and Real Estate (+1.0%) posted moderate gains. They benefited from yield curve steepening, rising chances of Fed rate cuts, and safe-haven flows. Financials were also propelled by investor appetite for banks and cyclical exposure amid interest rate stability and improved credit outlook.
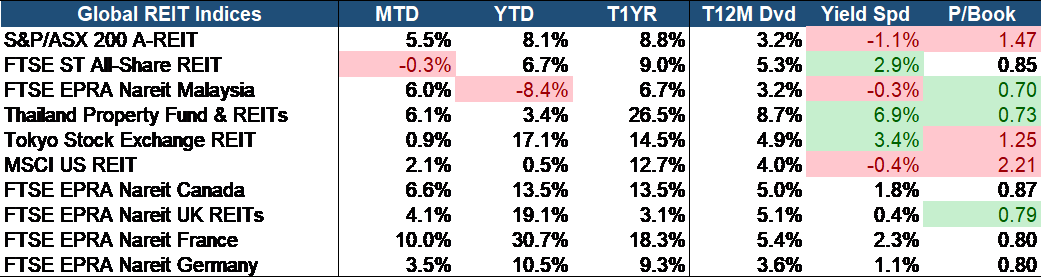
Source: Bloomberg (Total Return in USD terms)
Global REITs posted strong MTD gains overall, particularly in Australia (+5.5%), Thailand (+6.1%), Malaysia (+6.0%), Canada (+6.6%), UK (+4.1%), and France (+10.0%), reflecting renewed investor interest after April’s selling pressure. This rebound is supported by the US Fed’s rate pause, which eased borrowing cost concerns and bolstered asset valuations
Yield levels remain compelling. Many REITs continue to trade at attractive P/Book ratios below 1.0x. Singapore REITs (-0.3% MTD) continue to offer a compelling yield spread of 2.8%, the third highest globally and currently trade at a discounted Price-to-Book ratio of 0.87, presenting both value and income opportunities. We maintain a positive view on resilient and recession-proof subsectors such as Industrial and Data Center SREITs, which are better insulated from economic volatility. In addition, Singapore-focused Retail and Grade-A Office players are expected to benefit from resilient domestic demand, a constrained supply pipeline over the next 3–5 years, and potential re-rating opportunities due to current valuation mispricing.
EQUITY MARKET OUTLOOK
Market Turned Risk-On Despite Macro Uncertainty and Rising Yields
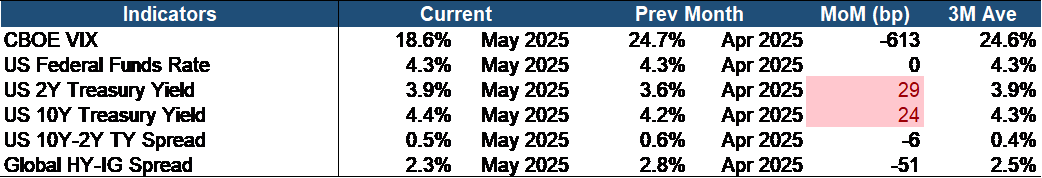 Source: Bloomberg.
By the end of May, market sentiment shifted noticeably risk-on as the equity fear index (CBOE VIX) dropped from 24.7% to 18.6%, a decline of 613 bp and below its three-month average of 24.6%. Global credit spreads have shown similar indication as well, with the HY‑IG spread narrowing 51 bp to 2.3%, reflecting some relief in risk sentiment.
Meanwhile, the US Treasury yield curve has bear-flattened as concerns over inflation and recession persists. The 2‑year Treasury yield rose 29 bp to 3.9%, and the 10‑year increased 24 bp to 4.4%, tightening the 10Y‑2Y spread to 0.5%.
Macroeconomic Trends Reflect Lingering Inflation and Slowing Manufacturing Activity
Source: Bloomberg.
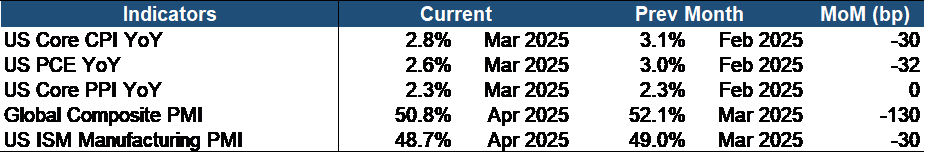
Key indicators continue to show persistent, but slightly moderating inflation. CPI and Core CPI are hanging near 2.3–2.8%. Meanwhile, the Fed’s benchmark – the PCE index, has cooled to 2.5% YoY, still hovering above its 2% target range. The leading PPI and Core PPI diverge in which producer inflation easing overall, but core pressures are building. Manufacturing activity remains weak as the ISM manufacturing PMI sank further to 48.7, the fifth straight month in contraction territory amid tariff-related disruptions. Global composite PMI also fell to 50.8, signifying global growth softness.
Expect ST USD Pressure and High Volatility, But LT Fundamentals Remain Intact
In the short term, the US dollar may face downward pressure from tariff-related inflation risks and the global search for yield elsewhere. However, long-term USD fundamentals remain strong, supported by the resilient labor market, healthy fiscal and current account positions, and the dollar’s role as the primary global reserve currency.
Equity markets currently face a complex backdrop currently with a combination of persistent inflation, uncertainty on central bank policy shifts, geopolitical and trade tensions, and sluggish manufacturing. While near-term volatility may stay elevated, we hold a constructive medium-to-long-term view on equities. The market currently trades at a 3-5% discount, offering a decent buffer for long-term investors. 1Q25 earnings largely remain solid, and secular growth trends like AI and digital infrastructure will continue to support the interest on equity as macro clarity improves and central banks potentially pivot toward easing.
CHINA MARKET UPDATE
China’s Consumer Price Index (CPI) for May shows signs of ongoing recovery in domestic consumption. On a month-on-month basis, CPI declined by 0.2%, while on a year-on-year basis, it fell by 0.1%. The primary drag on both monthly and annual CPI figures was lower energy prices.
Meanwhile, consumer demand continues to rebound. Hotel accommodation and travel prices rose by 4.6% and 0.8% month-on-month, respectively—both above seasonal norms. Notably, the increase in hotel prices marks the highest growth for the same period in nearly a decade. Looking ahead, CPI is expected to show a mild rebound from low levels, with recovering domestic demand remaining the main driver.
China’s trade data for May came in below expectations. Exports reached USD 316.1 billion, up 4.8% year-on-year (vs. expected 6.2%), while imports totalled USD 212.88 billion, down 3.4% year-on-year (vs. expected +0.3%). Overall, the weaker-than-expected trade data reflects that the effects of recent mutual tariff reductions between China and the U.S. have yet to materialize. It is anticipated that the front-loading effect driven by the 90-day tariff exemption window will become more evident in June and the following months. Despite the data miss, market concerns remain limited at this stage.
In the short term, market concerns over tariffs have eased, ushering in a phase of recovering risk appetite. From a medium- to long-term perspective, although external uncertainties persist, the A-share market now demonstrates greater strategic resilience and stronger underlying stability. The improving market sentiment suggests that market style may gradually shift back toward technology and growth sectors in May and June.
On one hand, with the ongoing release of domestic earnings reports and the diminishing impact of external tariff-related disturbances, the timing for positioning in tech and growth stocks is approaching. After a period of substantial correction, market sentiment and risk appetite have largely been reset. Risks related to tariffs and earnings have been gradually priced in, while the long-term growth potential of the technology sector—particularly the AI industry chain—is becoming increasingly evident.
On the other hand, based on indicators such as rolling return differentials and crowding levels, the recent adjustment in tech-related sectors appears to be largely complete. Since April, technology stocks have underperformed while dividend and domestic demand-driven sectors have seen a notable recovery. However, most technology subsectors remain near their bottom levels, still significantly below their pre-tariff-shock valuations.
Valuation dispersion within the A-share market remains pronounced. The current PE valuation percentiles for major indices are as follows: Wind All A Index at 62%, ChiNext Index at 10%, Shanghai Composite Index at 67%, and CSI 300 Index at 55%. Among sectors, the top three with the highest historical PE percentiles (ie. highly valued relative to their historical average PE ratios) are in the Real Estate, Computers and Consumer & Retail sectors. Conversely, the three sectors with the lowest historical PE percentiles are the Agriculture, Forestry, Animal Husbandry & Fishery, Telecommunications and Non-ferrous Metals sectors.
FIXED INCOME UPDATE
Source: Bloomberg; Returns are presented in USD terms
Source: Bloomberg; Returns are presented in USD terms
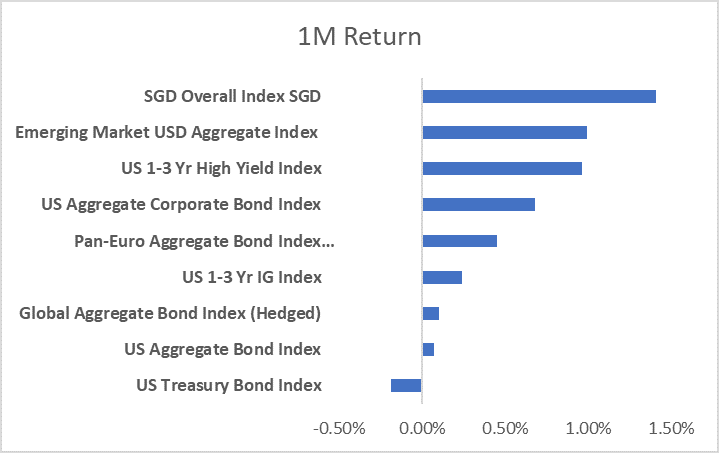
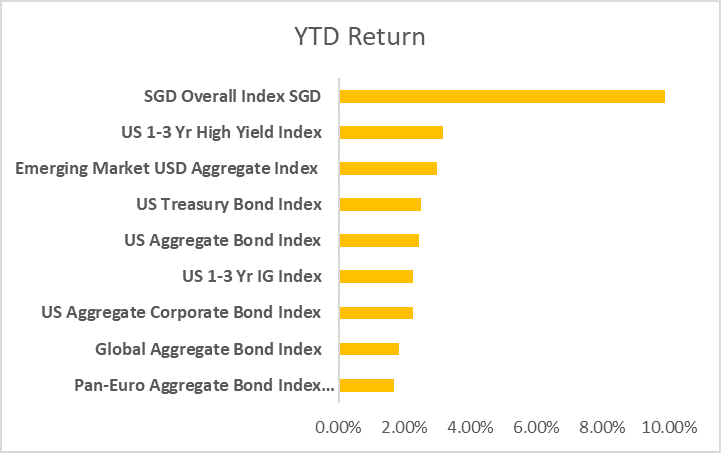
May proved to be a challenging month for global bond markets, as most major indices delivered only modest gains amid persistent macroeconomic uncertainty and fluctuating interest rate expectations. Singapore bonds stood out as a notable outperformer, generating a 1.4% return—benefiting not only from stable domestic yields but also from currency appreciation against the U.S. dollar. In contrast, most other regional and global bond indices struggled to surpass the 1% mark, reflecting the headwinds posed by sticky inflation data and mixed signals from central banks. The subdued performance highlights investor caution and the continued sensitivity of fixed income assets to monetary policy developments.
A key development in May was the renewed turmoil in U.S. Treasuries, particularly at the long end of the yield curve. Yields on 10-year and 30-year Treasuries surged, with the 10-year reaching 4.42% and the 30-year rising above 5%—a level last seen briefly in October 2023. This sharp move higher weighed heavily on returns, making U.S. Treasuries the only major bond index to post a negative performance for the month. The yield curve bear steepened, as long-term yields rose more than short-term rates, reflecting increased term premium and diminished investor demand. The selloff was exacerbated by weak auction participation at the long end, underscoring market concerns over growing U.S. fiscal deficits. Debate in Washington over potential tax cuts and long-term debt sustainability added to the pressure. Further unsettling markets, Moody’s downgraded the U.S. sovereign credit outlook from Aaa to Aa1, citing elevated debt levels and refinancing risks in a high-rate environment.
The continued weakness in the U.S. dollar provided a tailwind for Singapore dollar bonds and select emerging market debt. Singapore bonds benefited not only from stable credit fundamentals and limited net issuance, but also from their AAA-rated status—making them an attractive safe-haven alternative in a world of fiscal uncertainty. The Singapore dollar appreciated approximately 6% against the U.S. dollar over the first five months of 2025, driven by capital inflows and increasing diversification away from USD-denominated assets. This currency strength significantly contributed to the outperformance of SGD bonds in global terms. Meanwhile, emerging market bonds found modest relief as softer U.S. dollar trends and improving sentiment encouraged renewed investor interest, particularly in high carry opportunities.
In April 2025, the Monetary Authority of Singapore (MAS) implemented its second monetary policy easing of the year by slightly reducing the rate of appreciation of the Singapore dollar’s nominal effective exchange rate (S$NEER) policy band. This adjustment, the first since 2020, reflects the MAS’s response to moderating inflation and a weakening economic outlook. The MAS now projects core inflation to average between 0.5% and 1.5% in 2025, down from the earlier forecast of 1.0% to 2.0%, and has revised GDP growth expectations to a range of 0.0% to 2.0%, citing global trade tensions and subdued domestic demand as key factors.
Consequently, Singapore’s yield curve experienced a notable shift, with short-term rates declining more sharply than long-term rates. This flattening of the yield curve—where the spread between short- and long-term rates narrowed—was driven by the MAS’s accommodative stance and expectations of sustained low inflation. The 2-year SGS yield fell by approximately 50 basis points, while the 10-year yield declined by about 30 basis points, leading to price gains in SGD-denominated bonds. These developments underscore the MAS’s commitment to supporting economic stability amid global uncertainties.
Looking ahead, markets will be closely watching upcoming U.S. inflation data and Federal Reserve policy signals, which are expected to play a pivotal role in shaping interest rate expectations for the second half of the year. In addition, ongoing global trade negotiations and geopolitical developments could influence risk sentiment and capital flows. These factors will be critical in determining whether the Fed leans toward further rate hikes, holds rates steady, or signals a pivot toward easing—each of which would have significant implications for fixed income performance in June and beyond.
Trump’s Tax Bill and Japan’s Bond Market Jitters in May 2025
May 2025 was a turbulent month for global bond markets, with long-end yields surging across major economies. In the U.S., the 30-year Treasury yield climbed sharply, reaching 4.94% by the end of the month. This spike was driven by concerns over rising fiscal deficits and the potential impact of Donald Trump’s “One Big Beautiful Bill”, which passed the House and is now under Senate consideration. The bill includes over $5 trillion in tax cuts, aiming to make permanent the 2017 tax reductions while introducing new breaks on tips, overtime, and auto loan interest. However, its provisions—such as increased taxation on foreign investors—have raised fears of capital flight, further pressuring Treasury yields. Investors are now weighing the long-term implications of these policies on U.S. debt sustainability.
Meanwhile, Japan’s bond market faced its upheaval. Yields on super-long Japanese government bonds (JGBs) surged to record highs, with the 30-year yield peaking at 3.20%. The sharp rise was fuelled by weak demand at government auctions and speculation that the Ministry of Finance might reduce the issuance of long-dated bonds. The Bank of Japan’s gradual retreat from bond purchases has left a gap that life insurers and pension funds have struggled to fill. This shift has sparked concerns about global liquidity, as Japanese investors—historically major buyers of U.S. Treasuries—may begin repatriating funds, further exacerbating upward pressure on U.S. yields.
The interplay between these developments underscores the fragility of global fixed-income markets. As governments navigate fiscal policy shifts and central banks reassess their bond-buying strategies, investors are bracing for continued volatility. The coming months will be crucial in determining whether these trends solidify into a sustained repricing of long-term debt or if policymakers intervene to stabilize markets.
Important Information
This material is provided by Phillip Capital Management (S) Ltd (“PCM”) for general information only and does not constitute a recommendation, an offer to sell, or a solicitation of any offer to invest in any of the exchange-traded fund (“ETF”) or the unit trust (“Products”) mentioned herein. It does not have any regard to your specific investment objectives, financial situation and any of your particular needs. You should read the Prospectus and the accompanying Product Highlights Sheet (“PHS”) for key features, key risks and other important information of the Products and obtain advice from a financial adviser (“FA“) before making a commitment to invest in the Products. In the event that you choose not to obtain advice from a FA, you should assess whether the Products are suitable for you before proceeding to invest. A copy of the Prospectus and PHS are available from PCM, any of its Participating Dealers (“PDs“) for the ETF, or any of its authorised distributors for the unit trust managed by PCM.
An ETF is not like a typical unit trust as the units of the ETF (the “Units“) are to be listed and traded like any share on the Singapore Exchange Securities Trading Limited (“SGX-ST”). Listing on the SGX-ST does not guarantee a liquid market for the Units which may be traded at prices above or below its NAV or may be suspended or delisted. Investors may buy or sell the Units on SGX-ST when it is listed. Investors cannot create or redeem Units directly with PCM and have no rights to request PCM to redeem or purchase their Units. Creation and redemption of Units are through PDs if investors are clients of the PDs, who have no obligation to agree to create or redeem Units on behalf of any investor and may impose terms and conditions in connection with such creation or redemption orders. Please refer to the Prospectus of the ETF for more details.
Investments are subject to investment risks including the possible loss of the principal amount invested, and are not obligations of, deposits in, guaranteed or insured by PCM or any of its subsidiaries, associates, affiliates or PDs. The value of the units and the income accruing to the units may fall or rise. Past performance is not necessarily indicative of the future or likely performance of the Products. There can be no assurance that investment objectives will be achieved. Any use of financial derivative instruments will be for hedging and/or for efficient portfolio management. PCM reserves the discretion to determine if currency exposure should be hedged actively, passively or not at all, in the best interest of the Products. The regular dividend distributions, out of either income and/or capital, are not guaranteed and subject to PCM’s discretion. Past payout yields and payments do not represent future payout yields and payments. Such dividend distributions will reduce the available capital for reinvestment and may result in an immediate decrease in the net asset value (“NAV”) of the Products. Please refer to <www.phillipfunds.com> for more information in relation to the dividend distributions.
The information provided herein may be obtained or compiled from public and/or third party sources that PCM has no reason to believe are unreliable. Any opinion or view herein is an expression of belief of the individual author or the indicated source (as applicable) only. PCM makes no representation or warranty that such information is accurate, complete, verified or should be relied upon as such. The information does not constitute, and should not be used as a substitute for tax, legal or investment advice.
The information herein are not for any person in any jurisdiction or country where such distribution or availability for use would contravene any applicable law or regulation or would subject PCM to any registration or licensing requirement in such jurisdiction or country. The Products is not offered to U.S. Persons. PhillipCapital Group of Companies, including PCM, their affiliates and/or their officers, directors and/or employees may own or have positions in the Products. This advertisement has not been reviewed by the Monetary Authority of Singapore.