
Market Commentary – August 2025
EQUITY MARKET UPDATE
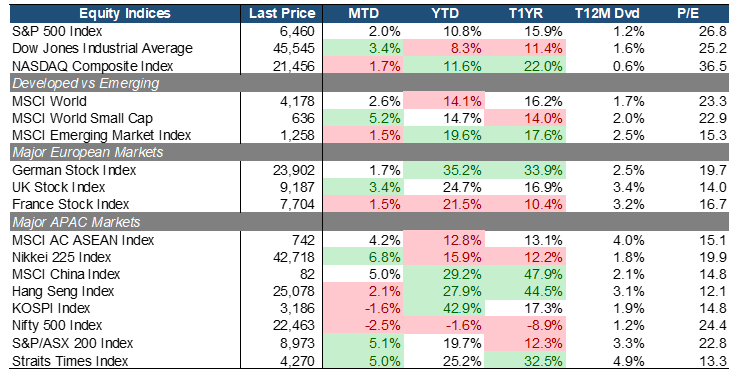
Source: Bloomberg (Total Return in USD terms)
The equity market momentum continued in August, with the S&P 500 delivering +2.0% MoM return, underpinned by growing expectations of monetary easing and strong gains in AI and tech-led earnings. Value displayed relative outperformance as the Dow Jones Industrial Average led with +3.4% MoM. The NASDAQ Composite with its heavy growth/tech weighting, still posted a solid +1.7% MoM but lagged the broader indices.
In the U.S., bleak jobs data and moderating inflation bolstered hopes for a monetary policy easing soon. Markets leaned toward at least one rate cut in September, possibly more, depending on data. Corporate earnings mostly beat expectations, particularly in sectors tied to AI, semiconductors, and tech infrastructure, which helped underpin the rally.
Small-Caps (+5.2% MTD) outpaced Large-Caps (+2.6% MTD) while emerging markets performance lagged (+1.5% MTD), but continued to outperform in YTD terms, with MSCI EM up ~19.6% YTD, driven especially by China’s rebound. In Europe, performance was mixed with UK (+3.4% MTD) leading the pack. Some markets benefited from weaker USD and expectations of improving economic activity. But macro uncertainties have muted gains relative to the U.S. and China. However, optimism on fiscal expansion or spending continued to supported the German equities (+1.7% MTD). The DAX has posted the best YTD performance among developed markets so far.
Closer to home (APAC), North Asia and ASEAN saw varied but generally positive returns. Japan (+6.8% MTD) outperformed the region counterparts although Australia, China, and Singapore are staying close behind at +5% MTD performance. Japan also benefited from trade deal tailwinds and global demand recovery while China equities rallied on signs of policy support (monetary and fiscal), infrastructure spending, and AI breakthrough. Singapore equities momentum remained strong supported by government support and rate-cut optimism. PE of 13x is still attractive compared to other developed markets and provide runway for the rally to continue.
 Source: Bloomberg (Total Return in USD terms)
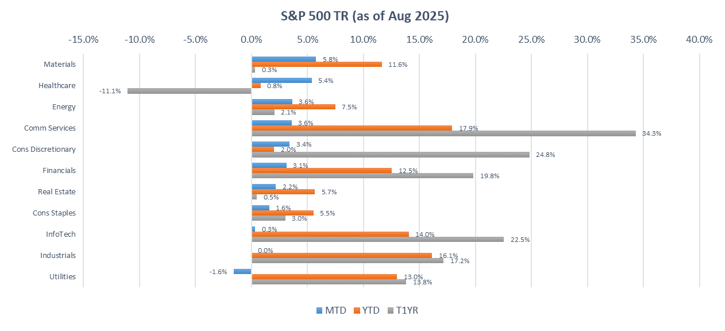
Within the S&P 500 sectors, Materials led (+5.8% MTD), supported by firmer commodity prices and improving demand signals out of China, particularly in base metals and construction-related inputs. Healthcare also outperformed (+5.4% MTD), as selective bargain-hunting in previously oversold large-cap names and resilient earnings delivery drove a short-term rebound.
On the other hand, Utilities (-1.6% MoM) faced pressures by higher Treasury yields and fading rate-cut expectations, which dampened the appeal of yield-sensitive defensives. Industrials were broadly flat, reflecting weak manufacturing activity data and trade-related uncertainty that offset pockets of strength in aerospace and automation demand.
 Source: Bloomberg (Total Return in Local Currency Terms)
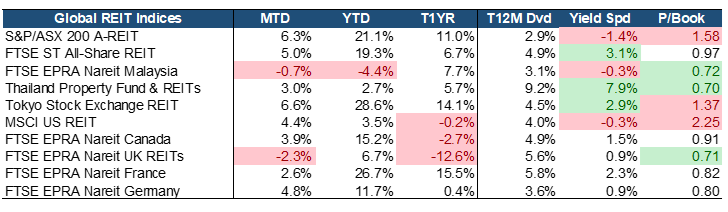
Global REITs delivered mostly positive performance in August, with top performers being Japan (+6.6% MTD), Australia (+6.3% MTD), and Singapore (+5% MTD). The performance was driven by the anticipated rate-cut from the Fed, supporting overall market rallies and providing a stable environment for income-generating assets like REITs. Both globally and in Singapore, REITs benefited from resilient balance sheets, attractive dividend yields, and broad-based sector strength, including recovery in hospitality, and continued demand in industrial and data centers.
Valuations and yields remain attractive. Many REITs continue to trade below book value, with Price-to-Book (P/B) ratios under 1.0x. Singapore REITs stand out, offering a compelling 3.1% yield spread, the second-highest globally, and trading at a fair 0.97x PB, reflecting both value and income potential. SREITs possess resilient balance sheets and broad-based sector strength, including recovery in Hospitality, and continued demand in Industrial and Data Centers which remain well-insulated from macroeconomic volatility.
EQUITY MARKET OUTLOOK
Signs of Resilience Amid Easing Volatility and Curve Re-Steepening
 Source: Bloomberg.
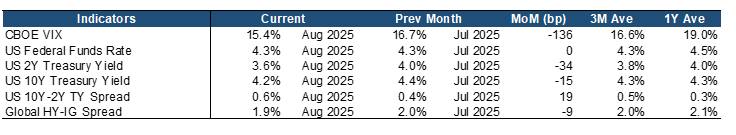
Market volatility eased further in August, with the CBOE VIX falling to 15.4% (-136 bps MoM), below both its 3M average (16.6%) and 1Y average (19.0%), underscoring continued investor optimism amid resilient earnings and AI-driven optimism. Credit conditions also improved as the Global HY-IG spread narrowed to 1.9% (-9 bps MoM), signaling sustained risk appetite despite lingering growth uncertainties.
Yields shifted lower across the curve, with the US 2Y Treasury yield down -34 bps MoM to 3.6% and the 10Y also lower by -15 bps to 4.2%, reflecting softer inflation prints and market positioning for eventual Fed easing. The 10Y–2Y spread widened modestly to 0.6% (+19 bps MoM), marking a bull-steepening of the yield curve. A bull-steepening signals the expectation of an expansive monetary policy, but also shows concerns on economic slowdown/recession that have resulted in investors seeking safety in ST government bonds. Meanwhile, the Fed Funds Rate held steady at 4.3%, broadly in line with market expectations.
Overall, markets continue to balance optimism for a soft landing with repricing risks tied to shifting rate expectations, while lower volatility and tighter spreads point to steady investor confidence heading into year-end.
Persistent Inflation and Early Signs of Global Growth Stabilization
 Source: Bloomberg.
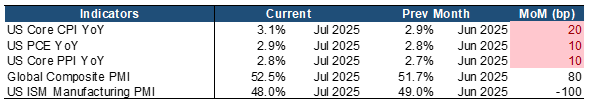
Key macro indicators for August suggest inflationary pressures remain sticky but contained, with evidence of modest firming in both consumer and producer prices. Core CPI rose to 3.1% YoY (+20 bps MoM), led by shelter costs and tariff-driven import prices. The Fed’s preferred gauge, Core PCE, inched higher to 2.9% YoY (+10 bps MoM). Meanwhile, Core PPI edged up to 2.8% YoY (+10 bps MoM), signaling persistent upstream cost pressures that is gradually creeping into consumer prices.
Growth indicators showed tentative stabilization, particularly outside the US. The Global Composite PMI strengthened to 52.5 (+80 bps MoM), reflecting resilient services demand and improving global orders. In contrast, US manufacturing momentum weakened further, with the ISM Manufacturing PMI falling to 48.0 (-100 bps MoM), marking the eight straight month of contraction and underscoring persistent industrial softness.
Overall, August data highlight a mixed backdrop: sticky inflation is likely to keep the Fed in a data-dependent stance, while global growth momentum is showing early signs of stabilization. With services strength offsetting US manufacturing weakness, risk assets remain supported, though tariff-related cost pressures and the pace of disinflation will be critical swing factors for the policy outlook into year-end.
Constructive Outlook Amid Sticky Inflation, Recession Fears, and AI-Driven Momentum
Equity markets remain constructive, supported by strong corporate earnings and resilient growth signals outside the manufacturing sector. Large AI-cycle companies reported robust results and guidance in late August, reinforcing technology-led leadership and investor optimism around AI-driven productivity gains. Capital expenditure beneficiaries also continue to provide a supportive earnings backdrop.
At the same time, inflation has remained sticky, keeping the Fed cautious and data-dependent. Signs of a cooling U.S. labor market may ease near-term inflation pressures and clarify the path for potential rate cuts. Weak job growth and a subdued economic outlook further suggest the likelihood and potential size of Fed easing.
Political risks, however, have risen. Public pressure on the Fed and high-profile legal actions against Board members have entered market considerations, introducing a factor that could amplify volatility around future policy decisions and weigh on investor confidence if perceived as a threat to central-bank independence.
Overall, the medium-term outlook is constructive. Earnings strength (driven by AI), stabilizing global demand, and a cooling labor market create a possible path toward easing. Yet sticky core inflation and rising political interference in central-bank affairs materially increase policy uncertainty, posing a downside risk to conviction.
CHINA MARKET UPDATE
In August, The Shanghai Composite Index reached its highest level since August 21, 2015 — marking a nearly 10-year high and demonstrating strong upward momentum. The ChiNext Index, representing smaller stocks, also showed sustained strength, reaching its highest point since February 15, 2023.
The core logic behind the current market rally remains solid — with new growth drivers continuously emerging and the trend of incremental capital inflows persisting, both of which continue to fuel market momentum. With the channels for medium- to long-term capital entry opening up, and an acceleration in inflows from margin financing, private equity, and other high-risk appetite funds, market liquidity is seeing notable improvement. Additionally, stronger-than-expected U.S. non-farm payroll data in July has raised expectations for a Fed rate cut in September. Easing global liquidity, combined with foreign investors’ continued underweight positioning in Chinese assets, suggests that foreign capital inflows may further boost liquidity in the A-share market. In the short term, the market is focused on high-growth areas such as pharmaceuticals and overseas computing power. Structurally, over the medium term, domestic technology and de-involution trends in the manufacturing sector are more likely to become key themes in the market.
Looking ahead, two areas warrant close attention:
- Market recovery and policy direction in Q3 2025: The policy focus is on structural adjustments. With continued emphasis on de-involution policies, a rebound in PPI (Producer Price Index) in the second half of the year is highly likely. However, sustained signals of economic recovery still need to be observed and confirmed.
- Market dynamics and theme rotation: The market is currently in a phase of concentrated hotspots — with cyclicals, technology, manufacturing, pharmaceuticals, and new consumer sectors all showing periodic strength. In the second half of the year, the market may still need to establish a clear leading theme. Specifically, a market uptrend theme requires broader and deeper momentum. Breakthroughs in domestic technology and globally competitive, de-involution-driven manufacturing may potentially become the main themes in H2. Although some volatility may arise, the overall upward sentiment in the market is unlikely to fade easily.
For the Phillip China Universal MSCI A50 Connect ETF, as the index constituents are primarily leading companies across various industries, their historical profitability has been relatively stable. Over the past decade, net profits declined in only in two years — 2016 and 2020 — with a compound annual growth rate (CAGR) of nearly 6% during the period. In terms of valuation, the MSCI China A50 Connect Index currently has a price-to-book (P/B) ratio of 1.3x, placing it near, but still below, the 50th percentile over the past 10 years. This valuation is slightly higher than that of the SSE 50 Index and is close to its historical average. The dividend yield stands at about 3.5%, which is higher than that of traditional broad-based A-share indices (e.g. similarly around 3.5% for SSE 50 Index, below 3% for CSI 300 Index, only 1.5% for CSI 500 Index and slightly above 1% for CSO1000 Index).
The MSCI China A50 Connect Index has a distinctly large-cap profile, with an average market capitalization of over RMB 500 billion, roughly equivalent to that of the SSE 50 Index. It represents one of the largest-cap broad-based indices in the A-share market. In terms of risk and return, MSCI China A50 Connect Index has delivered an annualized return of 6.5% since incepted in 2012. When including dividends, the total return index achieves an annualized return of over 9%, indicating a strong historical dividend performance. In comparison, its total return exceeds those of other broad-based A-share indices such as the SSE 50, CSI 300, CSI 500, and CSI 1000, all of which have total returns below 8.5%. On the volatility side, the MSCI China A50 Connect Index has an annualized volatility of 21.79%, which is lower than the A-share market average and only slightly higher than that of the CSI 300 Index among broad-based indices.
Among major asset classes, the MSCI China A50 Connect Index shows moderate correlation with bonds, gold, and U.S. equities. It has a higher correlation with the Hang Seng Tech Index, but a lower correlation with the broader Hang Seng Index. A breakdown reveals that the dividend-focused segment of the Hong Kong stock market has a very low correlation with the MSCI China A50 Connect Index — as low as -0.05.
Overall, the MSCI China A50 Connect Index primarily consists of large-cap industry leaders while also incorporating elements of the new economy. In terms of index construction methodology, dividend yield, and historical risk-return characteristics, it can be seen as an enhanced version of the SSE 50 and CSI 300 indices. Furthermore, compared to these two broad-based indices, the MSCI China A50 Connect Index exhibits lower correlations with a wider range of asset classes, which may help reduce overall portfolio volatility.
FIXED INCOME UPDATE
 Source: Bloomberg; Returns are presented in USD terms
 Source: Bloomberg; Returns are presented in USD terms
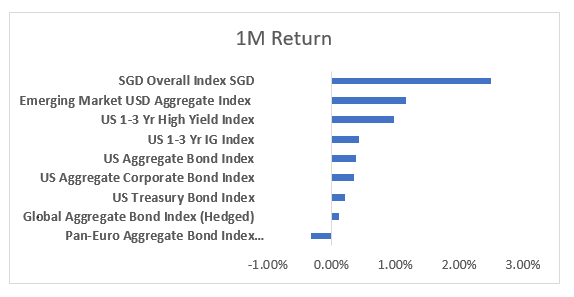
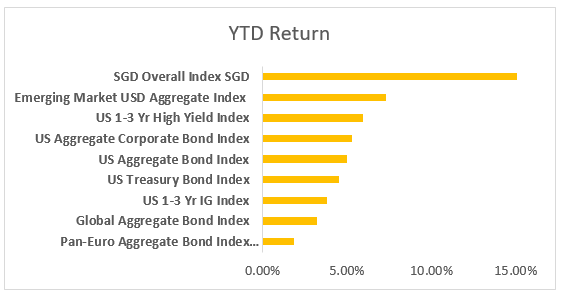
Bond markets were broadly positive in August, with nearly all major indices delivering gains. Once again, Singapore dollar bonds stood out as the top performer. The SGD Overall Index rose 2.5% in USD terms, extending its year-to-date leadership position and highlighting sustained investor demand for high-quality backed by Singapore’s political and currency stability.
Core U.S. benchmarks, including the Aggregate Bond Index and Treasuries, registered modest gains, reflecting a delicate balance between persistent inflation pressures and cautious optimism over the Fed’s policy path. In contrast, European bonds lagged, with the Pan-Euro Aggregate Index slipping into negative territory as long-end yields climbed. Investor sentiment was weighted down by fiscal concerns in the UK and heightened political uncertainty in France, where Prime Minister François Bayrou’s move to tie his government’s survival to a September 8 confidence vote on a controversial austerity budget unsettled. The 10-year OAT-Bund spread widened to around 80 basis points, its widest since April 2025.
The New Safe Haven? Asia Bonds Step Up as Developed Markets Stumble
August’s bond market moves underscored a world in transition. Long-end yields rose across major developed markets, driven less by growth expectations than by fiscal pressures, political instability, and shifting investor demand. In the US, the 30-year Treasury yield closed the month at 4.98%, approaching the psychologically important 5% level amid heavy issuance, waning demand from traditional buyers, and growing concerns over the long-term fiscal outlook
In the UK, 30-year Gilt yields surged to 5.73%, as investors grappled with elevated public spending, persistent inflation, and the fiscal uncertainty of the Labour Government’s Autumn Budget. Germany’s 30-year Bund yield hit a 14-year high, reflecting term premium normalisation despite weakening growth prospects. Meanwhile, France’s 10-year OAT-Bund spread widened to 79bps, its widest since April, as political turmoil over austerity measures unsettled investors and raised fresh doubts over fiscal credibility.
Japan’s long-end yields surged for similar— though more acute—reasons. The 30-year JGB yield reached 3.2% in late August, its highest level since the BoJ’s exit from Yield Curve Control in 2024. A weak 20-year auction, sticky core-core inflation at 3.4% YoY, and a sharp pullback in foreign demand triggered what some analysts described as a “panic-like move.” With public debt exceeding 260% of GDP and the BoJ scaling back monthly purchases, the market is recalibrating risk in a post-YCC world.
As developed markets stumble, Asia’s bond markets are emerging as not just for diversification, but as a credible leadership. Asian USD bonds have delivered year-to-date, supported by attractive all-in yields, robust credit fundamentals, and lower volatility relative to developed market peers. Importantly, this resilience appears structural rather than cyclical. Deep liquidity, improving market infrastructure, and rising participation from domestic investors are reshaping the region’s fixed income landscape. CNH bonds, once niche, are now increasingly drawing institutional flows on the back of falling onshore yields and improving credit quality. In Singapore, MAS’s calibrated policy stance and currency stability, continue to underpin investor demand for SGD-denominated assets.
These moves underscore a broader truth: the traditional anchors of global fixed income are showing signs of strain. And as they falter, Asia’s bond markets are no longer simply offering diversification – they are assuming a more strategic role, marked by growing credibility and relevance. Whether this shift proves to be a lasting realignment or transitory reprieve remains uncertain, but Asia’s ascent is becoming increasingly difficult for global investors to ignore.
Important Information
This material is provided by Phillip Capital Management (S) Ltd (“PCM”) for general information only and does not constitute a recommendation, an offer to sell, or a solicitation of any offer to invest in any of the exchange-traded fund (“ETF”) or the unit trust (“Products”) mentioned herein. It does not have any regard to your specific investment objectives, financial situation and any of your particular needs. You should read the Prospectus and the accompanying Product Highlights Sheet (“PHS”) for key features, key risks and other important information of the Products and obtain advice from a financial adviser (“FA“) before making a commitment to invest in the Products. In the event that you choose not to obtain advice from a FA, you should assess whether the Products are suitable for you before proceeding to invest. A copy of the Prospectus and PHS are available from PCM, any of its Participating Dealers (“PDs“) for the ETF, or any of its authorised distributors for the unit trust managed by PCM.
An ETF is not like a typical unit trust as the units of the ETF (the “Units“) are to be listed and traded like any share on the Singapore Exchange Securities Trading Limited (“SGX-ST”). Listing on the SGX-ST does not guarantee a liquid market for the Units which may be traded at prices above or below its NAV or may be suspended or delisted. Investors may buy or sell the Units on SGX-ST when it is listed. Investors cannot create or redeem Units directly with PCM and have no rights to request PCM to redeem or purchase their Units. Creation and redemption of Units are through PDs if investors are clients of the PDs, who have no obligation to agree to create or redeem Units on behalf of any investor and may impose terms and conditions in connection with such creation or redemption orders. Please refer to the Prospectus of the ETF for more details.
Investments are subject to investment risks including the possible loss of the principal amount invested, and are not obligations of, deposits in, guaranteed or insured by PCM or any of its subsidiaries, associates, affiliates or PDs. The value of the units and the income accruing to the units may fall or rise. Past performance is not necessarily indicative of the future or likely performance of the Products. There can be no assurance that investment objectives will be achieved. Any use of financial derivative instruments will be for hedging and/or for efficient portfolio management. PCM reserves the discretion to determine if currency exposure should be hedged actively, passively or not at all, in the best interest of the Products. The regular dividend distributions, out of either income and/or capital, are not guaranteed and subject to PCM’s discretion. Past payout yields and payments do not represent future payout yields and payments. Such dividend distributions will reduce the available capital for reinvestment and may result in an immediate decrease in the net asset value (“NAV”) of the Products. Please refer to <www.phillipfunds.com> for more information in relation to the dividend distributions.
The information provided herein may be obtained or compiled from public and/or third party sources that PCM has no reason to believe are unreliable. Any opinion or view herein is an expression of belief of the individual author or the indicated source (as applicable) only. PCM makes no representation or warranty that such information is accurate, complete, verified or should be relied upon as such. The information does not constitute, and should not be used as a substitute for tax, legal or investment advice.
The information herein are not for any person in any jurisdiction or country where such distribution or availability for use would contravene any applicable law or regulation or would subject PCM to any registration or licensing requirement in such jurisdiction or country. The Products is not offered to U.S. Persons. PhillipCapital Group of Companies, including PCM, their affiliates and/or their officers, directors and/or employees may own or have positions in the Products. This advertisement has not been reviewed by the Monetary Authority of Singapore.