
Market Commentary – October 2025
EQUITY MARKET UPDATE
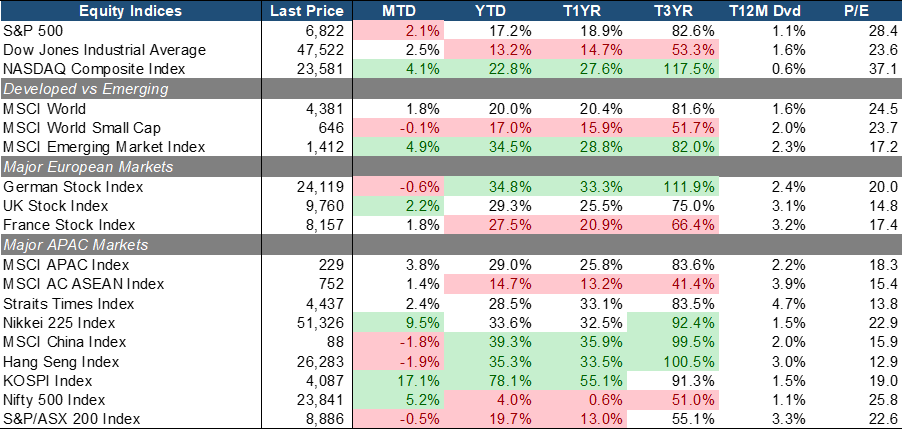
Source: Bloomberg (Total Return in USD terms)
Equities continued to be on an up-trend, but the momentum has slowed. The S&P 500 reported a +2.0% MoM return, still mainly driven by optimism for by a monetary easing and resilient AI/tech-led earnings. The tech-heavy NASDAQ Composite (+4.9% MoM) has outpaced value stocks as loosely represented by the DJIA (+2.5% MoM). The Fed has cut its benchmark interest rates in late October to a 3.75-4% range, but its plan for December remains uncertain as its guidance was quite hawkish if incoming data disappoints. Corporate earnings have exceeded expectations, with the S&P 500 companies delivering 13% EPS growth YoY, the fourth consecutive quarter of double-digit earnings growth with outsized contributions from firms in the InfoTech, Communication Services, and Healthcare sectors.
Small-Caps (-0.1% MoM) lagged Large-Caps (+1.8% MoM) while emerging markets performance gained momentum (+4.9% MoM and 28.8% YTD), driven by the inflows into APAC tech infrastructures. In Europe, performance was mixed with UK equities (+2.2% MoM) leading on the back of hopes of a BoE rate cut and a relatively attractive valuation level. German equities (-0.6% MoM) fell due to weak economic sentiment and macro trade uncertainties.
Closer to home. APAC and ASEAN equities saw varied but generally positive returns. SK (+17.1% MoM) and Japan (+9.5% MoM) were the best performing equity markets. SK equities rallied on the back of AI and tech stocks, on top of optimism around a trade deal with the US, and strong overall export data. Japanese equities benefited from the election of a new prime minister signaling political stability, and strong gains in AI-related tech names as well. In contrast, Chinese/HK equities (-1.8%/+1.9% MoM) underperformed primarily because of renewed trade tensions with the US, poor economic indicators like declining exports and weak domestic demand, and lingering fragility in investor sentiment.
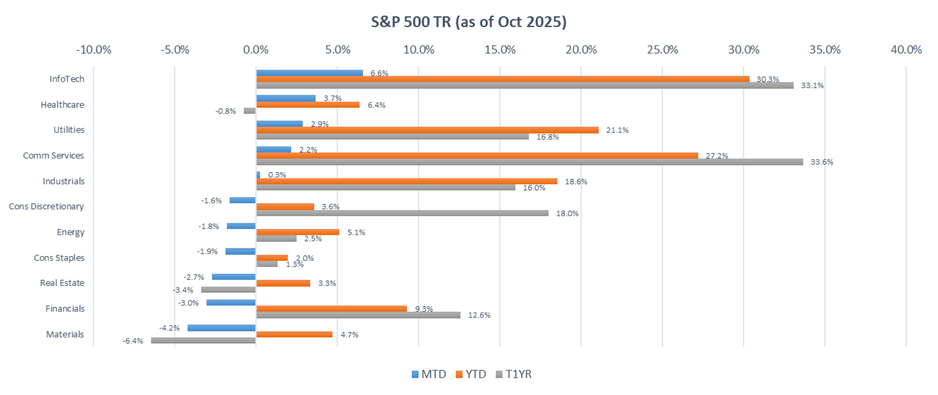 Source: Bloomberg (Total Return in USD terms)
Within the S&P 500, InfoTech (+6.6% MoM) remains the best performer driven by AI-linked growth and cloud infrastructure plays, supported by strong earnings momentum despite the increased in enterprise capex spending. Health Care (+3.7% MoM) advanced on improving regulatory clarity and renewed investor appetite for innovation, particularly in biotech and AI-driven drug development. Meanwhile, Utilities (+2.9% MoM) benefited from defensive positioning and structural demand tied to power-grid demand and AI-led Data Centre expansion.
Conversely, Materials (-4.2% MTD), Financials (-3.0% MTD), and Real Estate (-2.7% MTD) lagged due to cyclical and rate-sensitive headwinds. Materials weakened on softer manufacturing orders and global demand, amplified by falling commodity prices while Financials slipped as concerns over loan quality and narrowing net-interest margins.
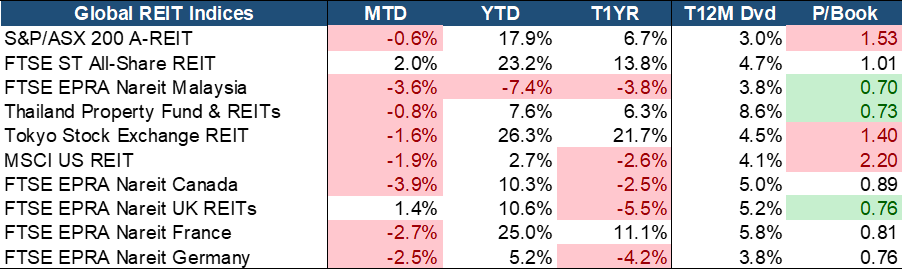 Source: Bloomberg (Total Return in Local Currency Terms)
Global REITs reported a mostly negative performance in October, with Singapore (+2% MoM) and UK (+1.3% MoM) delivering the only positive returns MoM. Higher-for-longer rates have pressured REIT valuations and reignited funding costs concern.
SREITs continue to benefit from resilient balance sheets, attractive dividend yields, and broad-based sector strength, including recovery in hospitality, and continued demand in industrial and data centers. Valuations and yields remain attractive with a compelling 3% yield spread, the second highest globally, and trading at a fair 1x PB, reflecting both value and income potential. SREITs possess resilient balance sheets and broad-based sector strength, including recovery in Hospitality, and continued demand in Industrial and Data Centers which remain well-insulated from macroeconomic volatility.
EQUITY MARKET OUTLOOK
Market Remains Highly Sensitive: Positioned for Optimism, Prone to Sharp Repricing
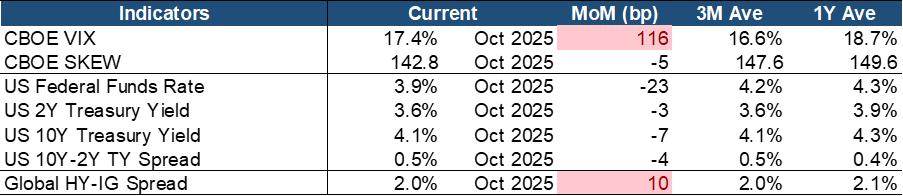 Source: Bloomberg.
Market volatility has reignited in October, with the VIX rising by 116 bps MoM, crossing its T3M average (~17%) but still sits under T1Y average (~19%). The SKEW has fallen to 143 but still hovering near 150 level. Concern for an AI bubble or an unexpected tail risk event has grown, but ongoing strength in corporate earnings and elevated excitement around AI-driven productivity still had investors feared for missing out.
Yields shifted slightly lower across the yield curve, with the US 2Y Treasury yield down -3 bps MoM to 3.6% and the 10Y also lower by -7 bps to 4.1%, reflecting softer inflation prints and market positioning for eventual Fed easing. The 10Y-2Y spread tightened modestly to 0.5% (-4 bps MoM), marking a bull-flattening of the yield curve. This means that the market is growing bullish overall and has shifted positioning to LT bonds in the prospect of falling inflation and ST interest rates. In parallel, credit markets also showed some risk pricing as the global high yield and investment-grade (HY–IG) spread widened to 2% (+2 bps MoM). But the level is still below the LT averages, underscoring a sustained risk appetite.
Overall, markets are navigating a delicate balance between soft-landing optimism and the risk of abrupt repricing. Volatility has firmed but remains below long-term norms, signaling cautious sentiment rather than full-blown stress. The bull-flattening of the U.S. yield curve reflects incremental confidence in disinflation and eventual Fed easing, yet the curve is not steep enough to imply aggressive cuts. Credit spreads remain contained, showing that risk appetite is intact even as investors demand a modest premium for uncertainty. This leaves markets hypersensitive. Strong earnings and AI-driven productivity themes can sustain risk-taking, but any upside inflation surprise, hawkish policy signal, or geopolitical shock could quickly unwind positioning and drive volatility higher again.
Mixed Macro Backdrop: Stabilizing Growth but Persistent Inflation Keeps Policy Cautious
 Source: Bloomberg.
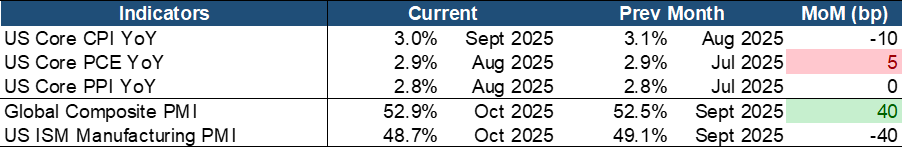
Key macro indicators continue to suggest that inflation remains sticky, though not runaway, while growth signals are mixed but showing glimmers of stabilization globally. The U.S. government shutdown has caused missing September inflation data and the data-dependent Fed will likely to take a more cautious decision as a result. But the Fed’s preferred gauge, Core PCE, stayed at 2.9% YoY in August, still anchored above central bank 2% comfort zones. The leading Core PPI stayed at 2.8% YoY as well, hinting at underlying cost pressures upstream that could still feed into consumer inflation over time.
Growth indicators showed tentative stabilization, particularly outside the US. The Global Composite PMI strengthened to 52.0 (+40 bps MoM), reflecting resilient services demand and improving global orders. The US manufacturing momentum however has worsened with the ISM Manufacturing PMI declining to 48.7 (-40 bps MoM), marking a tenth-straight month of contraction and underscoring persistent industrial softness in the US.
Sticky inflation continues to restrain Federal Reserve policy and underscores its data reliance. Core inflations remain elevated and risks from tariff pass-through, wage pressures and upstream cost-push remain present. At the same time, growth signals are patchy but showing glimmers of stabilization outside the U.S. where tech sectors are offsetting lingering weakness in manufacturing and trade. Overall, the outlook for growth will hinge on the extent to which consumer spending and services remain resilient, and whether external demand (particularly from Europe and China) can firm up enough to compensate for continued industrial softness. Meanwhile, industrial weakness may be approaching a trough, but risks such as higher commodity/energy prices, tariff escalation and renewed supply-chain constraint are still present. Taken together, the balance of risks suggests that central banks will remain cautious about prematurely cutting rates until disinflation becomes more durable and growth momentum becomes broader based.
AI-Led Momentum Supports a Constructive Outlook, but Fragile Macro Undercurrents Persist
We maintain a constructive medium-term outlook, underpinned by the momentum of the AI investment cycle and robust near-term corporate earnings. The upswing in AI-related capex and broadening earnings strength across technology, infrastructure and industrial players has reinforced confidence in a secular growth premium. At the same time, macro conditions are offering incremental support. The U.S. labour market shows signs of cooling, inflation pressures appear to be moderating, and the Fed’s policy is gradually shifting toward easing.
Looking further out, the long-term outlook remains cautiously optimistic but is subject to elevated structural risks. Valuations in many AI names are lofty and concentration risk is growing. Moreover, investor confidence in central-bank independence and policy credibility is increasingly coming into focus. As such, markets remain highly sensitive to any perception of premature easing or loss of policy discipline. In practical terms, this means investors should cautiously lean into the equity opportunity while maintaining guardrails, emphasizing diversification beyond U.S. mega-caps and factoring in potential tail risks around inflation, policy reversal or AI hype fatigue.
CHINA EQUITY MARKET UPDATE
Due to multiple factors such as a high comparison base and fiscal spending patterns, China’s economic growth in Q4 is under pressure. The probability of large-scale stimulus measures aimed at boosting domestic demand in the near term is expected to be low. Driven by the high base effect and sluggish month-on-month momentum, real GDP growth is expected to moderate in the second half. Recently, key economic indicators have shown a clear month-on-month decline, mainly due to:
- A second downturn in the property market and unresolved local fiscal strains, resulting in continued marginal slowdown in real estate and infrastructure investment
- Decreasing incremental support from new-energy subsidies
- Profitability pressures on manufacturing firms, leading to weakening investment momentum
Based on GDP estimates, growth has been declining for consecutive months, though the magnitude remains manageable. A simple regression using industrial production and services data suggests GDP growth above Q3 last year, and high-frequency indicators point to Q3 GDP growth of around 4.7%–4.9%. At present, achieving the full-year target of around 5% still appears feasible.
On October 17, the A-share market experienced a significant decline across the spectrum, both in large caps (e.g. Shanghai Composite Index down 2.0%), and smaller stocks (e.g. ChiNext Index and STAR 100 declined 3.4% and 4.2%, respectively). The A-share market downturn has shown clear “re-balancing” characteristics, with previously outperforming sectors leading the decline. Sectors that recorded strong gains in the second half, such as electronics, communications, and electrical equipment, saw relatively larger pullbacks in October. From a valuation perspective, although overall market valuation has risen after the earlier rally, it is still far from historical peaks. From a margin-financing perspective, the balance of margin financing in the A-share market surpassed the 2015 June peak in October. However, given the substantial expansion of total market capitalization over the past decade, margin financing as a share of free-float market capitalization is about 2.5%, significantly below the 4.7% level recorded at the 2015 peak.
Therefore, overall A-share market risk remains within a reasonable range. The key drivers supporting the A-share market remain intact:
- Amid a new wave of technological revolution and industrial transformation, China has given rise to a large number of high-quality enterprises with strong international competitiveness.
- The market is currently at the bottoming stage of the earnings down-cycle, and listed companies’ earnings are expected to recover systematically going forward
- Domestic interest rates remain at historical lows, which enhances the relative attractiveness of equity assets
- The government has introduced a series of important policies to support the high-quality development of the capital market.
FIXED INCOME UPDATE
 Source: Bloomberg; Returns are presented in USD terms
 Source: Bloomberg; Returns are presented in USD terms
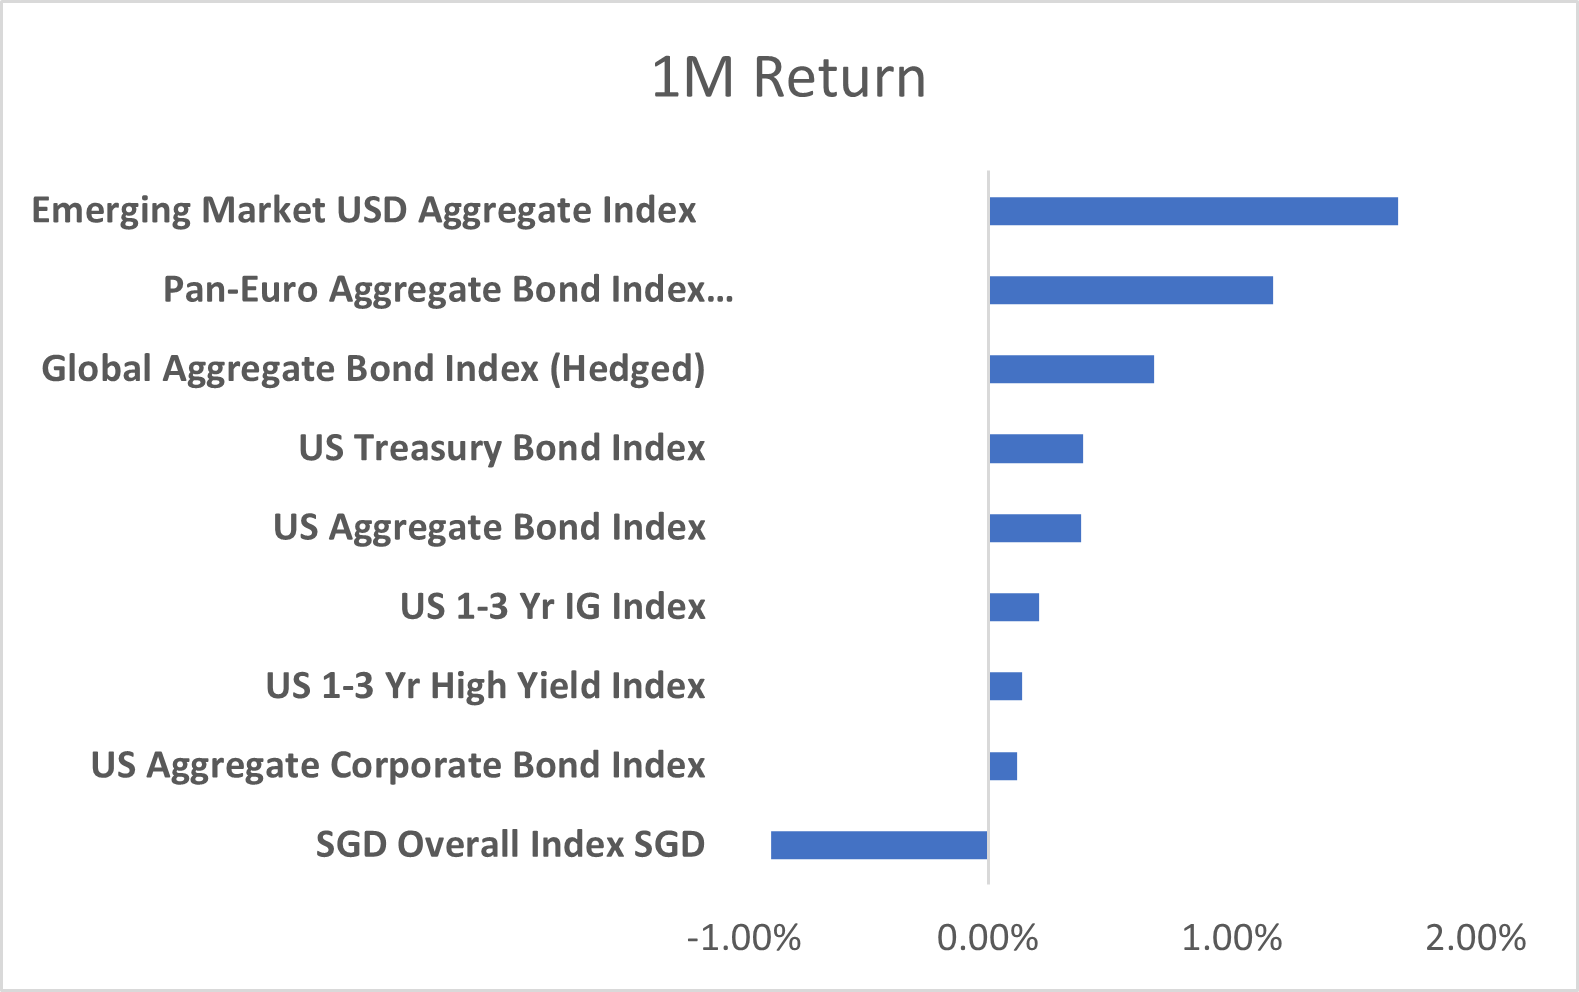
Bond market returns were broadly positive in October, with most major indices delivering modest gains. The notable exception was the SGD Overall Index, which posted a second consecutive monthly decline in USD terms its underperformance driven primarily by FX translation effects, as the Singapore dollar weakened against the US dollar from mid-September through October. The marked a reversal from earlier in the year, when SGD strength had consistently amplified USD-based returns. In contrast, the Emerging Market USD Aggregate Index and the Pan-Euro Aggregate Bond Index outperformed, supported by stable credit spreads and a modest rally in long-end rates. Eurozone yields declined as fiscal concerns eased and inflation pressures moderated, while EM debt benefited from renewed carry demand amid a more stable risk backdrop.
The macro backdrop was dominated by the Federal Reserve’s October rate cut—25 basis points to a 3.75–4.00% range, despite being dovish in action, markets interpreted this as a hawkish cut, as Chair Powell framed the move as a “risk-balancing” adjustment rather than the start of an easing cycle. His emphasis that a December cut was “not a foregone conclusion” prompting a rise in long-end yields as investors recalibrated the likely path of policy easing.
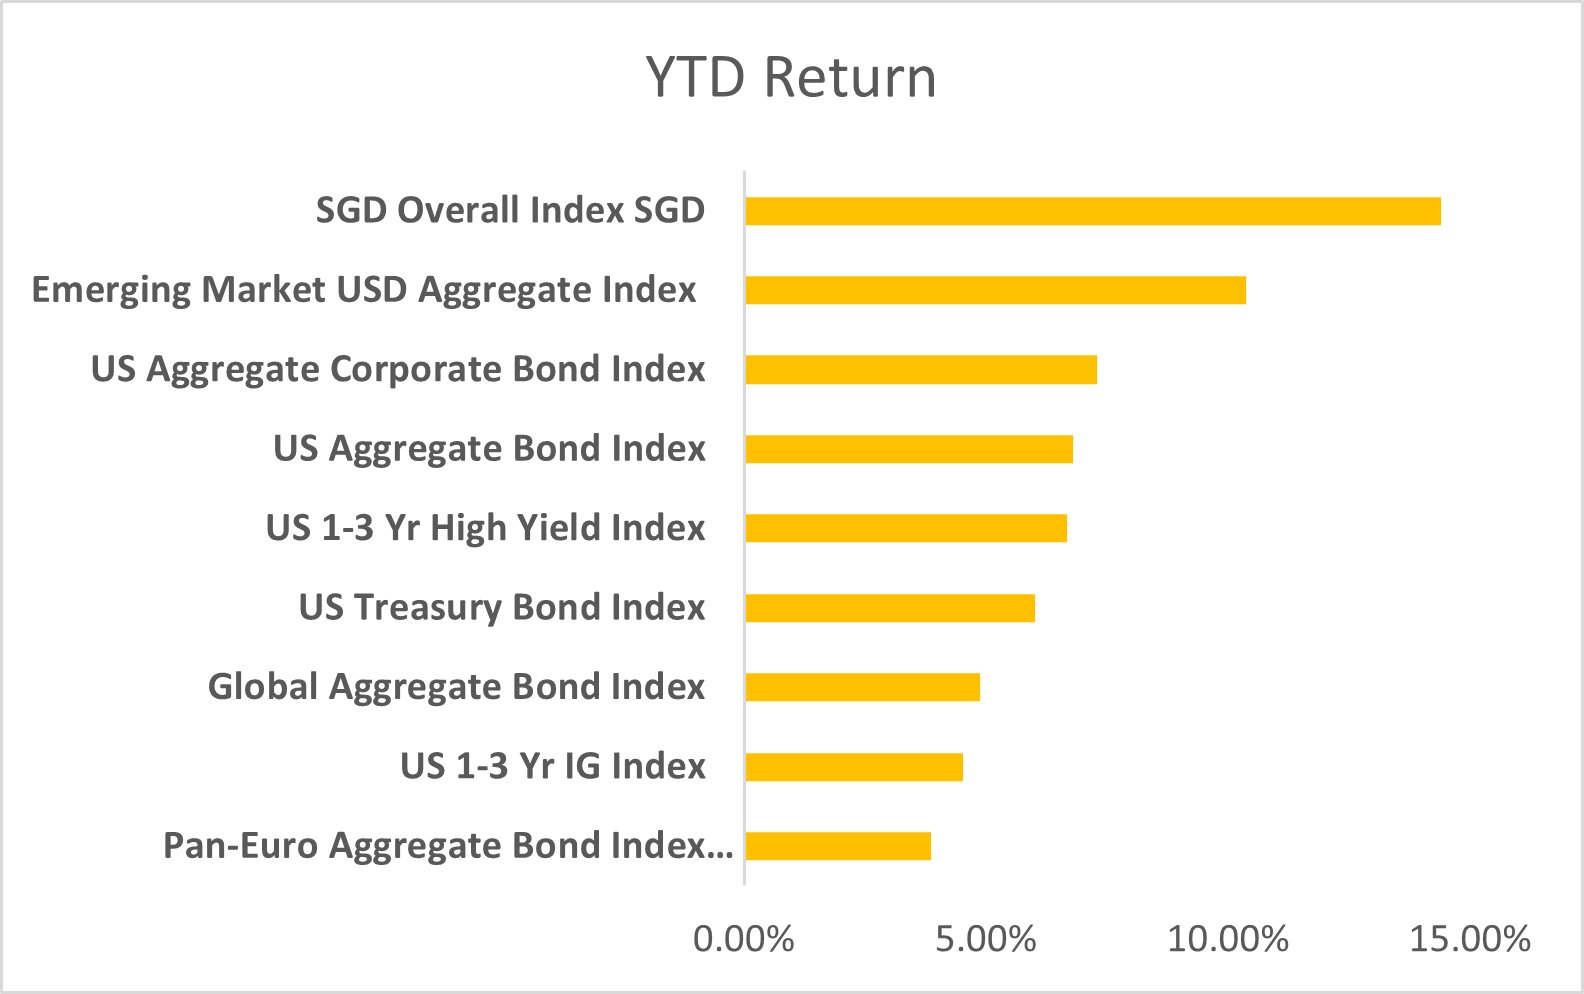
Year-to-date, the SGD Overall Index remains the top performer, with gains approaching 15%, supported by resilient domestic credit fundamentals and a favourable rate environment. Falling interest rates have directly boosted bond valuations. Emerging Market USD debt and US corporate bonds have also delivered strong YTD returns, while the Pan-Euro Aggregate Index continues to lag amid persistent rate volatility and lingering macroeconomic uncertainty across the eurozone.
FED to Wind Down QT; Eyes Potential Shift Towards Short-Term Liquidity
The Federal Reserve announced it will conclude its multi-year quantitative tightening (QT) program on December 1, 2025, marking a pivotal shift in its balance sheet strategy. The Fed’s holdings currently stand at $6.6 trillion, down from nearly $9 trillion at the pandemic peak. Beyond reduction, the Fed is expected to gradually rebalance its portfolio towards shorter dated Treasury bills while reducing exposure to longer-dated Treasuries and agency MBS. This adjustment is aimed at bolstering short-end liquidity as reserve balances tighten.
While less discussed, this compositional shift carries important market implications. By stepping back from the long end, the Fed removes a key source of duration demand, placing upward pressure on long-end yields and steepening the curve. This dynamic could tighten overall financial conditions influence credit spreads and increase cross-asset volatility. For fixed income managers, the shift underscores the need to reassess curve exposure, liquidity positioning, and sensitivity to policy signaling.
MAS Launches Grant to Catalyse Carbon Credit Ecosystem
Locally, the Monetary Authority of Singapore’s launch of a S$15 million Financial Sector Carbon Market Development Grant to accelerate financial institutions’ participation in the country’s growing carbon credit ecosystem. The initiative reinforces Singapore’s ambition to become a regional hub for high-integrity carbon trading and underscores MAS’s view belief that financial institutions—including banks, insurers, and asset managers play a pivotal role in scaling market infrastructure and liquidity.
While not directly tied to fixed income, the grant could catalyse ESG-labelled issuance and structured products linked to carbon pricing as corporates pursue decarbonization financing. Over time, this may broaden the local sustainable finance toolkit through instruments such as transition bonds, carbon-linked notes, or hybrid structures embedding environmental performance triggers. The move highlights MAS’s continued focus on innovation and transparency—key enablers of investor confidence and sustainable capital formation.
Important Information
This material is provided by Phillip Capital Management (S) Ltd (“PCM”) for general information only and does not constitute a recommendation, an offer to sell, or a solicitation of any offer to invest in any of the exchange-traded fund (“ETF”) or the unit trust (“Products”) mentioned herein. It does not have any regard to your specific investment objectives, financial situation and any of your particular needs. You should read the Prospectus and the accompanying Product Highlights Sheet (“PHS”) for key features, key risks and other important information of the Products and obtain advice from a financial adviser (“FA“) before making a commitment to invest in the Products. In the event that you choose not to obtain advice from a FA, you should assess whether the Products are suitable for you before proceeding to invest. A copy of the Prospectus and PHS are available from PCM, any of its Participating Dealers (“PDs“) for the ETF, or any of its authorised distributors for the unit trust managed by PCM.
An ETF is not like a typical unit trust as the units of the ETF (the “Units“) are to be listed and traded like any share on the Singapore Exchange Securities Trading Limited (“SGX-ST”). Listing on the SGX-ST does not guarantee a liquid market for the Units which may be traded at prices above or below its NAV or may be suspended or delisted. Investors may buy or sell the Units on SGX-ST when it is listed. Investors cannot create or redeem Units directly with PCM and have no rights to request PCM to redeem or purchase their Units. Creation and redemption of Units are through PDs if investors are clients of the PDs, who have no obligation to agree to create or redeem Units on behalf of any investor and may impose terms and conditions in connection with such creation or redemption orders. Please refer to the Prospectus of the ETF for more details.
Investments are subject to investment risks including the possible loss of the principal amount invested, and are not obligations of, deposits in, guaranteed or insured by PCM or any of its subsidiaries, associates, affiliates or PDs. The value of the units and the income accruing to the units may fall or rise. Past performance is not necessarily indicative of the future or likely performance of the Products. There can be no assurance that investment objectives will be achieved. Any use of financial derivative instruments will be for hedging and/or for efficient portfolio management. PCM reserves the discretion to determine if currency exposure should be hedged actively, passively or not at all, in the best interest of the Products. The regular dividend distributions, out of either income and/or capital, are not guaranteed and subject to PCM’s discretion. Past payout yields and payments do not represent future payout yields and payments. Such dividend distributions will reduce the available capital for reinvestment and may result in an immediate decrease in the net asset value (“NAV”) of the Products. Please refer to <www.phillipfunds.com> for more information in relation to the dividend distributions.
The information provided herein may be obtained or compiled from public and/or third party sources that PCM has no reason to believe are unreliable. Any opinion or view herein is an expression of belief of the individual author or the indicated source (as applicable) only. PCM makes no representation or warranty that such information is accurate, complete, verified or should be relied upon as such. The information does not constitute, and should not be used as a substitute for tax, legal or investment advice.
The information herein are not for any person in any jurisdiction or country where such distribution or availability for use would contravene any applicable law or regulation or would subject PCM to any registration or licensing requirement in such jurisdiction or country. The Products is not offered to U.S. Persons. PhillipCapital Group of Companies, including PCM, their affiliates and/or their officers, directors and/or employees may own or have positions in the Products. This advertisement has not been reviewed by the Monetary Authority of Singapore.