
Market Commentary – September 2025
EQUITY MARKET UPDATE
Source: Bloomberg (Total Return in USD terms)
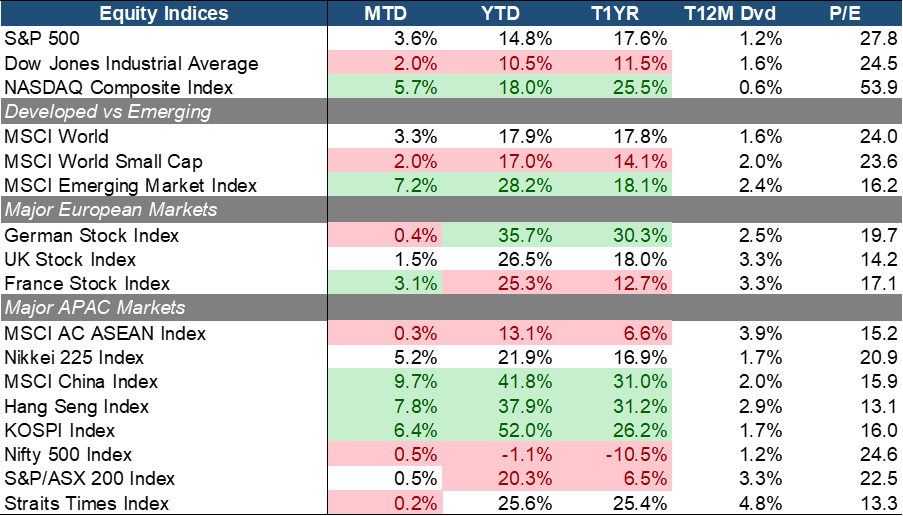
The equity market momentum continued in September, with the S&P 500 delivering +3.0% MoM return, underpinned by growing expectations of monetary easing and AI/tech-led earnings. The tech-heavy NASDAQ Composite (+5.7% MoM) outperformed value as loosely represented by the DJIA (+2% MoM). The Fed’s mid-September 25 bps cut materially shifted market positioning toward duration and growth, and its guidance kept the door open to further easing if incoming data soften. Cooling momentum in the U.S. market together with moderating inflation readings, has helped sustain the view that policy could be eased without reigniting inflation. Corporate earnings have also broadly beat expectations, with outsized strength concentrated in AI-exposed software, semiconductor and tech-infrastructure names, reinforcing the leadership of growth and tech into month-end.
Small-Caps (+2% MoM) lagged Large-Caps (+3.3% MoM) while emerging markets performance gained momentum (+7.2% MoM and 28.2% YTD), driven by the inflows into Chinese equities. In Europe, performance was mixed with France (+3.1% MoM) leading the pack. Some markets benefited from weaker USD and expectations of improving economic activity. But macro uncertainties have muted gains relative to the U.S. and China. However, optimism on fiscal expansion or spending continued to supported the German equities (+35/7% YTD) that have reported the best YTD performance among developed markets so far.
Closer to home. North Asia and ASEAN equities saw varied but generally positive returns. China/HK (+9.8%/+7.8% MoM) and South Korean (+6.4% MoM) outperformed while most others including Singapore were rather flat MoM. China and SK equities rallied on signs of policy support (monetary and fiscal), infrastructure spending, and cyclical/tech exposure.
 Source: Bloomberg (Total Return in USD terms)
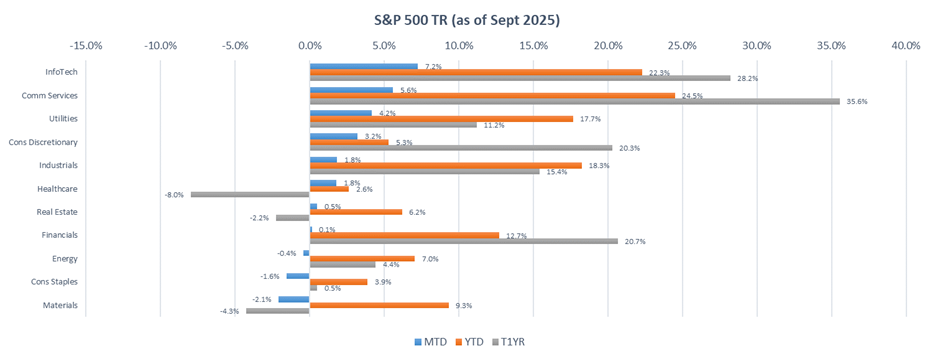
Within the S&P 500, growth sectors such InfoTech (+7.2% MoM) and Comm Services (+5.6% MoM) performed the best driven by the continued momentum of tech stocks. Utilities (+4.2% MoM) also relatively did better, likely due to attractive valuation level, coupled with the anticipation of an industry-wide gains from AI/Data Center electricity demand.
On the other hand, uncertainty on U.S. trade policy/tariffs impacts, weak consumer confidence data, and a general outlook for an economic slowdown have resulted in Materials (-2.1% MoM) and Consumer Staples (-1.6 MoM). Energy (-0.4% MoM) also underperformed in light of a supply-demand surplus expected in the short-term.
 Source: Bloomberg (Total Return in Local Currency Terms)
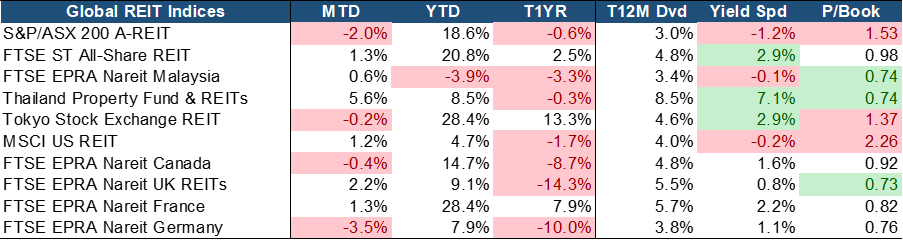
Global REITs reported mixed MoM performance in September, with top performers being Thailand (+5.6% MoM) and UK (+1.3% MoM). The performance was driven falling interest rate environment, providing demand for income-generating assets like REITs. Both globally and in Singapore, REITs benefited from resilient balance sheets, attractive dividend yields, and broad-based sector strength, including recovery in hospitality, and continued demand in industrial and data centers.
Valuations and yields remain attractive. Many REITs continue to trade below book value, with Price-to-Book (P/B) ratios under 1.0x. Singapore REITs stand out, offering a compelling 3% yield spread, the second-highest globally, and trading at a fair 0.98x PB, reflecting both value and income potential. SREITs possess resilient balance sheets and broad-based sector strength, including recovery in Hospitality, and continued demand in Industrial and Data Centers which remain well-insulated from macroeconomic volatility.
EQUITY MARKET OUTLOOK
Signs of Resilience Amid Easing Volatility and Curve Re-Steepening
 Source: Bloomberg.
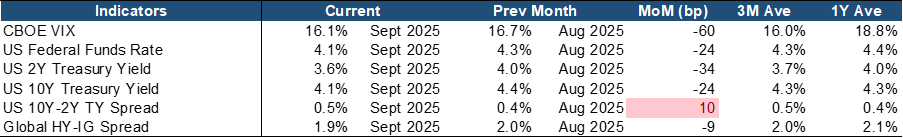
Market volatility continued to recede in September, with the CBOE VIX declining to 16.1% (-60 bps MoM). This sits just below its T3M average (16%) and well under its T1Y average (~19%), underscoring that investors’ confidence (or complacency) amid ongoing strength in corporate earnings and elevated excitement around AI-driven productivity. In parallel, credit markets also showed resilience. The global high yield minus investment-grade (HY–IG) spread tightened to 1.9% (-9 bps MoM), reflecting sustained risk appetite even with macro growth uncertainties still in play.
Yields shifted lower across the yield curve, with the US 2Y Treasury yield down -34 bps MoM to 3.6% and the 10Y also lower by -15 bps to 4.1%, reflecting softer inflation prints and market positioning for eventual Fed easing. The 10Y-2Y spread widened modestly to 0.5% (+10 bps MoM), marking a bull-steepening of the yield curve. The Fed Funds Rate has also fallen by 24 bps to 4.1% in-line with the Fed’s 25 bps rate cut in the same month. A bull-steepening (i.e. short yields falling faster than long yields) typically suggests expectations of more accommodative monetary policy ahead, but it can also reflect market cautious positioning into shorter maturities as a hedge against growth risk or recession fears. In other words, investors may be signaling that further easing is expected, but only if growth falters enough to force the Fed’s hand.
Overall, markets continue to balance optimism for a soft landing with repricing risks tied to shifting rate expectations. The fall in volatility and tighter spreads point to robust investor confidence, but volatility often rebounds sharply when inflation surprises upward again or geopolitical shocks emerge. The yield curve is not dramatically steep yet, so while markets are leaning toward an easing narrative, they’re not fully pricing in aggressive cuts.
Inflation Remains Sticky, While Global Growth Shows Early Signs of Stabilization
 Source: Bloomberg.
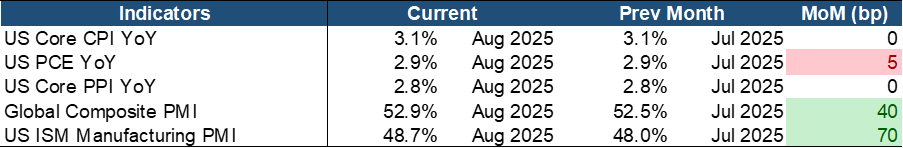
Key macro indicators continue to suggest that inflation remains sticky, though not runaway, while growth signals are mixed but showing glimmers of stabilization outside the U.S. Core CPI stayed at 3.1% YoY led by shelter costs and tariff-driven import prices. The Fed’s preferred gauge, Core PCE, remained rather flat at 2.9% YoY, still anchored above central bank comfort zones. The leading Core PPI stayed at 2.8% YoY as well, hinting at underlying cost pressures upstream that could still feed into consumer inflation over time.
Growth indicators showed tentative stabilization, particularly outside the US. The Global Composite PMI strengthened to 52.0 (+40 bps MoM), reflecting resilient services demand and improving global orders. The US manufacturing momentum has also started picking up with the ISM Manufacturing PMI rising to 48.7 (+70 bps MoM), although it is still in the ninth-straight month of contraction and underscoring persistent industrial softness. This divergence of strength in services, coupled with weakness in manufacturing is now a recurring pattern across many advanced economies.
Sticky inflation will likely keep the Fed restrained and data-dependent, as policymakers remain cautious about committing prematurely to rate cuts until disinflation proves more durable. The modest rebound in manufacturing may indicate that industrial weakness is approaching a trough, with improving demand from China and Europe potentially supporting a mild recovery. However, macro-economic risks such as tariff pass-throughs, higher energy or commodity prices, and sustained wage pressures could all reignite inflationary surprises. As such, overall growth resilience will hinge on the continued strength of services and consumer spending, as well as the extent to which external demand can offset persistent softness in the manufacturing sector.
Constructive Medium-Term Outlook Anchored by AI Momentum, Despite Inflation and Policy Risks
Equity markets continue to look constructive in the near to medium term, underpinned by AI-led corporate earnings. The outsized performance and forward guidance from leading tech and AI-related firms have reinforced confidence in technology’s growth premium, while broader capex beneficiaries help provide earnings support beyond just software and platforms. At the same time, emerging signs of a weaker economic outlook and cooling U.S. labor market may help temper inflation pressures and clarify when rate cuts become viable. Looking out into the longer term, the outlook for global equities remains cautiously optimistic, but with elevated risks. Continued broadening of equity participation outside the U.S. mega-caps (e.g. small and mid-caps in Europe and Asia) could help diversify returns and reduce concentration risk, emphasizing the importance of equities beyond the “Magnificent Seven” as valuations skew toward those few mega-tech names.
However, structural challenges persist. Elevated valuations in AI-driven names, alongside rising political interference and potential threats to central-bank independence, could heighten market volatility, particularly if confidence in the Fed’s policy credibility weakens. Markets remain highly sensitive to any perception of premature policy easing or diminished central-bank autonomy, underscoring that while the equity outlook is constructive, it rests on a fragile foundation of trust in policy discipline and macro stability.
CHINA EQUITY MARKET UPDATE
September brought a mix of muted economic momentum, encouraging policy signals and continued positive market sentiment as investors weighed recent economic data against expectations for further stimulus.
Externally, attention remained on the evolving US–China trade negotiations. The two sides had earlier announced that the tariff truce—originally set to expire in August—would be extended for another three months, with both parties citing “constructive progress” on tariff rollbacks and technology export conditions. The United States also formally confirmed the easing of curbs on certain semiconductor design tools and high-end AI chip exports, a move that helped stabilize sentiment in China’s technology sector. At the same time, global investors continued to monitor or potential shifts in trade rhetoric that could affect China-related assets.
Domestically, China’s August macro data painted a mixed picture. Industrial production growth eased slightly to 5.2% year on year, while retail sales expanded by 3.4%, reflecting subdued consumer sentiment. Exports was up 4.4% year on year, also a relatively subdued number. The People’s Bank of China kept its key lending rate — the one-year loan prime rate— at record lows for a fourth straight month in September, in line with market expectations, against a backdrop of weakening domestic momentum.
In late September, the State Council reaffirmed its focus on fostering high-quality growth and improving corporate profitability in manufacturing. Policymakers also reiterated their intention to address industrial overcapacity and support private enterprise financing, echoing earlier efforts to curb destructive internal competition (“involution”) across key sectors such as electric vehicles and solar energy.
Looking ahead, attention will turn to the Fourth Plenum meetings scheduled for October, where the framework for the upcoming 15th Five-Year Plan is expected to be outlined. Markets will watch closely for details on industrial upgrading, fiscal reforms, and measures to boost domestic demand.
The MSCI China A 50 Connect Index posted a strong gain of 5.1% in September, supported by broad-based strength in a number of sectors including technology, materials, energy and consumer discretionary. The market has been strong year to date in 2025, despite mixed macro data and global policy uncertainty. Flows into emerging markets in the wake of a weak US dollar have benefited major countries in this category such as China. Low interest rates have also been a strong tailwind, as returns from alternative investment instruments such as fixed income pale in comparison in such an environment, while real estate undergoes a secular bear market.
FIXED INCOME UPDATE
 Source: Bloomberg; Returns are presented in USD terms
 Source: Bloomberg; Returns are presented in USD terms
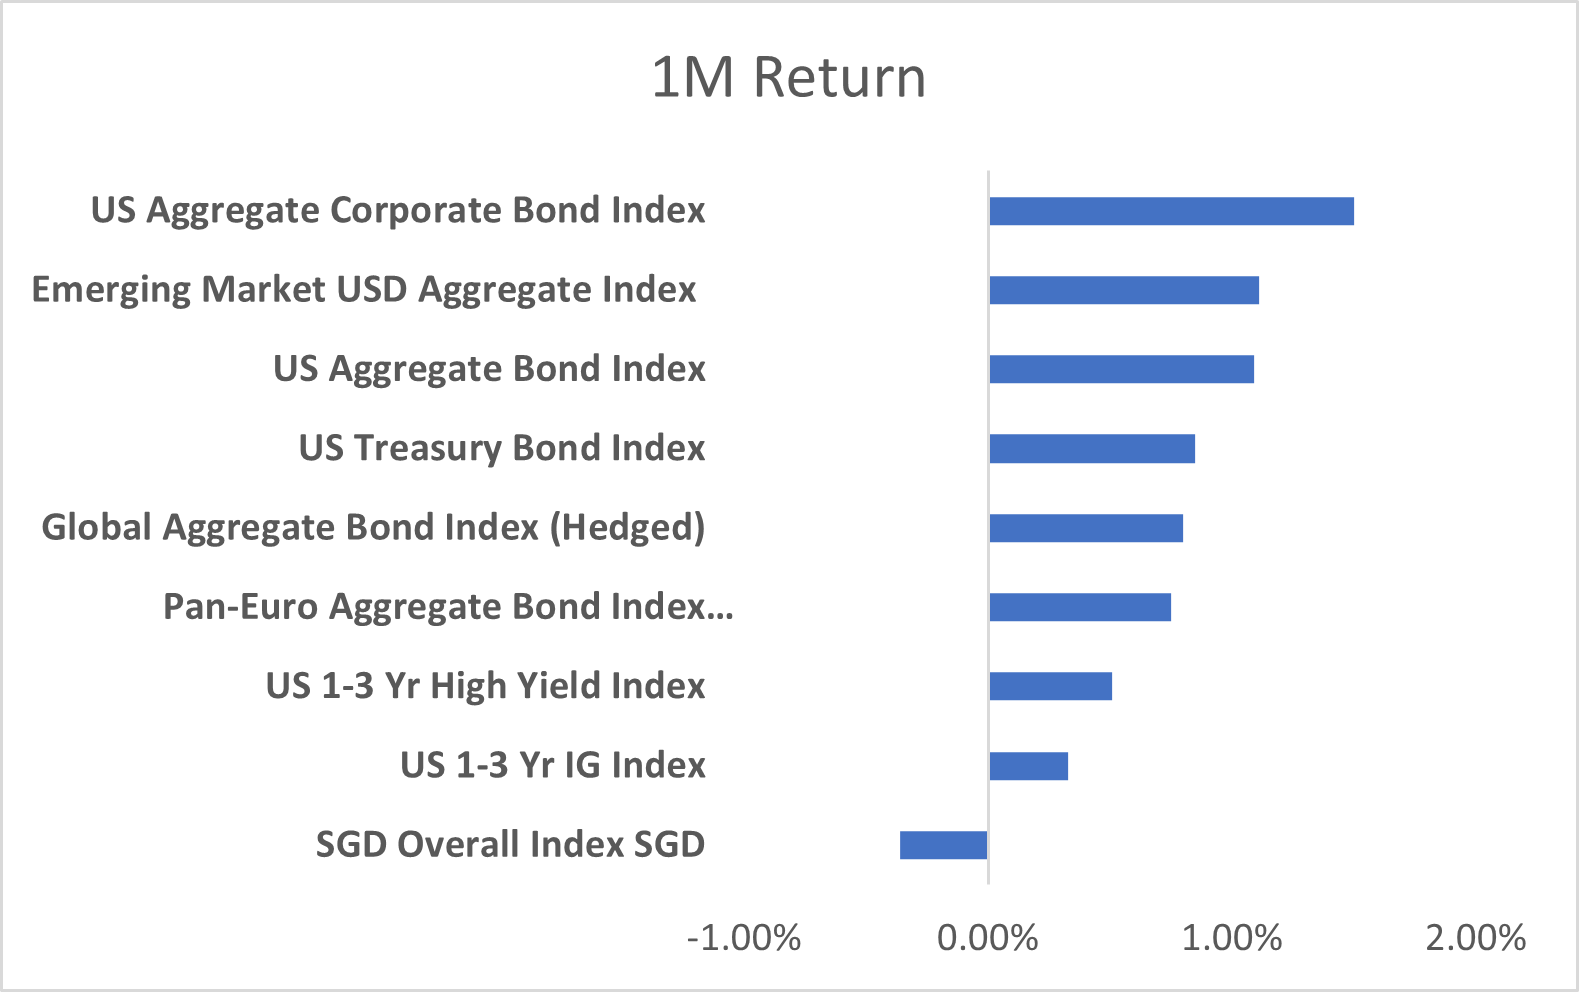
Bond market returns were broadly positive in September, with most major indices delivering modest gains. Long-end yields declined slightly over the month, providing a tailwind for duration-heavy benchmarks indices. The US 10-year Treasury yield ended September around 4.2%, down from intra-month highs, while the 30-year yield settled at 4.7%. This move was driven not so much by disinflation as the Federal Reserve’s evolving policy stance. Fed Chair Jerome Powell described the September rate cut as a “risk-management” measure to address labour market weakness and elevated uncertainty. Markets interpreted this as a signal of further easing ahead, helping anchor long terms yields and drive additional curve flattening.
Credit-oriented indices outperformed in September, led by the US Aggregate Corporate Bond Index and the Emerging Market USD Aggregate Index. Stable credit spreads and improving risk sentiment supported carry strategies, particularly in USD-denominated assets.
In contrast, the SGD Overall Index was the sole laggard on a one-month basis in USD terms, despite its strong year-to-date performance. This underperformance was driven primarily by FX translation effects, as the Singapore dollar weakened against the US dollar toward the month-end, eroding USD-based returns.
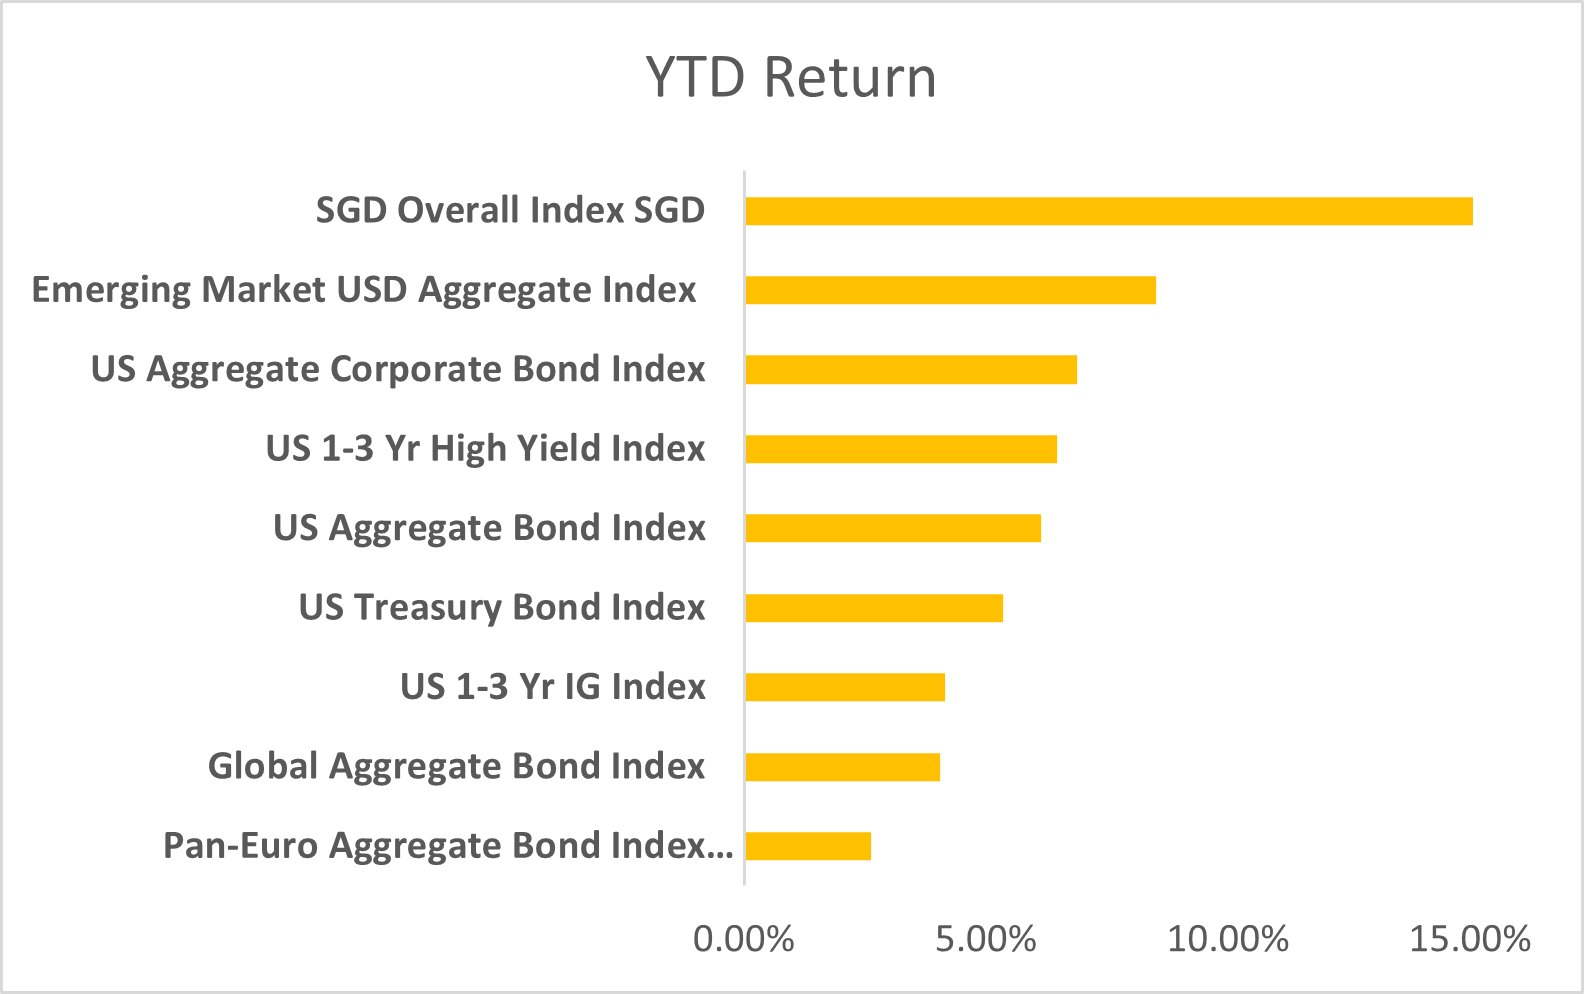
Year-to-date, the SGD Overall Index remains the top performer, with gains approaching 15%, supported by resilient local credit conditions and favourable duration exposure. Emerging Market USD debt and US corporate bonds have also delivered strong returns, while the Pan-Euro Aggregate Index continues to lag, weighted down by persistent rate volatility and ongoing macroeconomic uncertainty across the eurozone.
From Shutdowns to Sovereigns: Global Rebalancing in a Fragile Fiscal Era
One of the more consequential developments in September was the growing tension between U.S. fiscal policy and global debt market dynamics. As Congress scrambled to avert a government shutdown, investors were reminded of the structural vulnerabilities underpinning the Treasury’s funding strategy. Although a short-term continuing resolution prevented immediate disruption, the episode highlighted the reputational cost of repeated brinkmanship and reignited concerns about long-term debt sustainability.
Compounding these concerns was the Treasury’s increasing reliance on short-term bill issuance. With fiscal deficits widening and refinancing needs accelerating, the front end of the curve experienced a surge in supply—raising questions about rollover risk and the resilience of demand under tighter liquidity conditions. Although recent auctions were well-covered, the skew toward shorter maturities risks artificially steepening the front end of the curve, as excess supply pushes short-dated yields higher relative to intermediate tenors. This dynamic complicates curve positioning and benchmark tracking for institutional investors, particularly those managing duration-sensitive mandates.
Against this backdrop, global investors have begun rebalancing exposure toward non-U.S. sovereign markets. Canada saw a notable increase in foreign issuance, with supranational and corporates tapping into strong demand for CAD-denominated bonds amid its stable macro-economic and institutional environment. In Japan, foreign investors aggressively accumulated super-long JGBs, capitalizing on a twist-flattening of the yield curve driven by hawkish Bank of Japan signalling and easing fiscal concerns following political turnover. Meanwhile, Asian credit markets—including SGD-denominated bonds—continue to outperform on the year, buoyed by resilient local fundamentals, favourable duration profiles, and relative insulation from U.S. fiscal volatility.
Together, these flows reflect a broader recalibration in global fixed income allocation—where governance credibility, curve stability, and FX diversification, as investors navigate a more fragile fiscal era.
Important Information
This material is provided by Phillip Capital Management (S) Ltd (“PCM”) for general information only and does not constitute a recommendation, an offer to sell, or a solicitation of any offer to invest in any of the exchange-traded fund (“ETF”) or the unit trust (“Products”) mentioned herein. It does not have any regard to your specific investment objectives, financial situation and any of your particular needs. You should read the Prospectus and the accompanying Product Highlights Sheet (“PHS”) for key features, key risks and other important information of the Products and obtain advice from a financial adviser (“FA“) before making a commitment to invest in the Products. In the event that you choose not to obtain advice from a FA, you should assess whether the Products are suitable for you before proceeding to invest. A copy of the Prospectus and PHS are available from PCM, any of its Participating Dealers (“PDs“) for the ETF, or any of its authorised distributors for the unit trust managed by PCM.
An ETF is not like a typical unit trust as the units of the ETF (the “Units“) are to be listed and traded like any share on the Singapore Exchange Securities Trading Limited (“SGX-ST”). Listing on the SGX-ST does not guarantee a liquid market for the Units which may be traded at prices above or below its NAV or may be suspended or delisted. Investors may buy or sell the Units on SGX-ST when it is listed. Investors cannot create or redeem Units directly with PCM and have no rights to request PCM to redeem or purchase their Units. Creation and redemption of Units are through PDs if investors are clients of the PDs, who have no obligation to agree to create or redeem Units on behalf of any investor and may impose terms and conditions in connection with such creation or redemption orders. Please refer to the Prospectus of the ETF for more details.
Investments are subject to investment risks including the possible loss of the principal amount invested, and are not obligations of, deposits in, guaranteed or insured by PCM or any of its subsidiaries, associates, affiliates or PDs. The value of the units and the income accruing to the units may fall or rise. Past performance is not necessarily indicative of the future or likely performance of the Products. There can be no assurance that investment objectives will be achieved. Any use of financial derivative instruments will be for hedging and/or for efficient portfolio management. PCM reserves the discretion to determine if currency exposure should be hedged actively, passively or not at all, in the best interest of the Products. The regular dividend distributions, out of either income and/or capital, are not guaranteed and subject to PCM’s discretion. Past payout yields and payments do not represent future payout yields and payments. Such dividend distributions will reduce the available capital for reinvestment and may result in an immediate decrease in the net asset value (“NAV”) of the Products. Please refer to <www.phillipfunds.com> for more information in relation to the dividend distributions.
The information provided herein may be obtained or compiled from public and/or third party sources that PCM has no reason to believe are unreliable. Any opinion or view herein is an expression of belief of the individual author or the indicated source (as applicable) only. PCM makes no representation or warranty that such information is accurate, complete, verified or should be relied upon as such. The information does not constitute, and should not be used as a substitute for tax, legal or investment advice.
The information herein are not for any person in any jurisdiction or country where such distribution or availability for use would contravene any applicable law or regulation or would subject PCM to any registration or licensing requirement in such jurisdiction or country. The Products is not offered to U.S. Persons. PhillipCapital Group of Companies, including PCM, their affiliates and/or their officers, directors and/or employees may own or have positions in the Products. This advertisement has not been reviewed by the Monetary Authority of Singapore.