
Market Commentary – December 2025
EQUITY MARKET UPDATE
Source: Bloomberg (Total Return in USD/Local Currency terms)
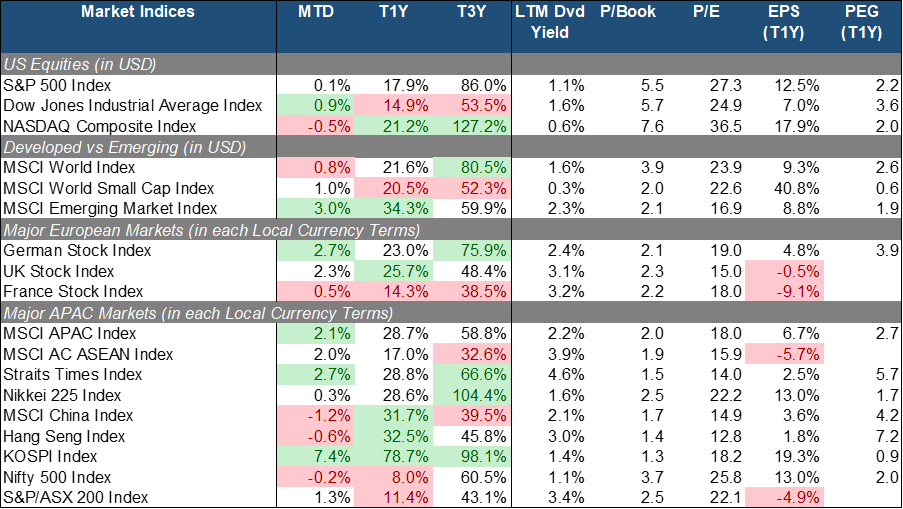
Equities delivered mixed monthly performance in December. The S&P 500 was flat MoM while value stocks as loosely represented by the DJIA (+0.9% MoM) fared better than the tech-heavy NASDAQ Composite (-0.5% MoM). Overall, equities wrapped up 2025 with double-digit returns across the board, riding on the back on AI-led growth and the expectations for a continued interest rate downcycle.
Global Small-Caps (+1% MoM) slightly edging Large-Caps (+0.8% MoM), while Emerging Markets outperformed (-3% MoM). In Europe, we have observed positive monthly performance as well led by German equities (+2.7% MoM) considering constructive fundamentals relative to the eurozone. But for the past year, UK equities have also outpaced their peers overall on the back of hopes of an imminent Bank of England rate cut and a relatively attractive valuation level.
Closer to home, APAC equities reported mixed results with the top performing markets being South Korea (+7.4% MoM) and Singapore (+2.7% MoM). Singapore continued to be a haven for investors given its low inflation, on top of resilient economic growth and strong policy support while South Korea benefitted from a stabilizing political climate and inflows into its tech stocks. Both South Korea and China/HK also had the strongest performance of the year among APAC equities due to the heavy concentration of semiconductor and AI-related companies in their benchmarks.
China/HK equities (-1.2%/-0.6% MoM) have fallen for two-straight months amid mixed economic signals and heightened volatility. China posted a record trade surplus in December, but trade with U.S. continued to decline sharply due to tariffs impact. The weakness of the property sector, concerns over a soft labor market, cautious household spending, and subdued consumer demand also contributed to the weakening sentiment.
 Source: Bloomberg (Total Return in USD terms)
Within the S&P 500, Financials (+3.1% MoM) delivered the best performance for the month. This is likely due to anticipations of improving banking and capital markets activity on the back of further rate cuts in 2026. Materials (+2.2% MoM) came a close second on the back of precious metals (i.e. silver and platinum) and copper rally, which saw strong demand throughout 2025 but had their prices spiked up at the end of the year. Meanwhile, Industrials (+1.2% MoM) outperformed due to the robust demand backlog of the U.S. Aerospace and Defense companies, not forgetting the significant gains from AI power solutions and infrastructure companies as well.
In the other hand, Utilities (-5.1% MoM), Real Estate (-2.2% MTD), and Consumer Staples (-1.6% MTD) lagged. Utilities underperformed due to their yield sensitivity and limited growth catalysts in a higher-for-longer rate environment, while Real Estate was weighed down by elevated financing costs and lingering structural headwinds in office and select property segments. Consumer Staples also lagged as investors gravitated toward higher-growth opportunities, compounded by softer volume growth and margin pressures from elevated input costs. Overall, December’s performance reflected a market backdrop that rewarded cyclical and growth exposure over defensive positioning.
 Source: Bloomberg (Total Return in Local Currency terms)
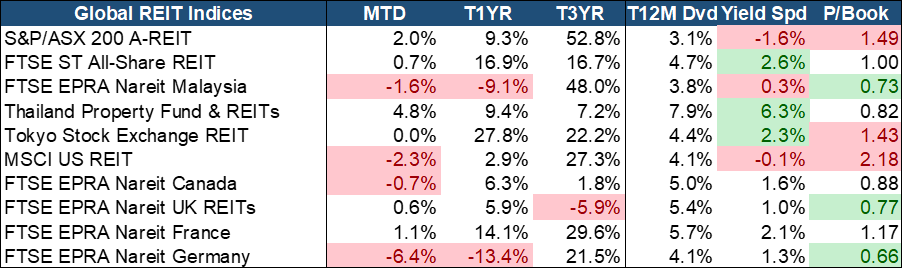
Global REITs reported a mostly positive performance in December, with Thailand (+4.8% MoM) and Australia (+2% MoM) performing the best. S-REITs (0.7% MoM) have relatively lagged, but continue to benefit from resilient fundamentals, attractive dividend yields, and broad-based sector strength, including recovery in hospitality, and continued industrial and retail. Valuations and yields remain attractive with a compelling 2.6% trailing yield spread, the second highest globally, and trading at a fair 1x PB considering the quality of the assets.
EQUITY MARKET OUTLOOK
Market Remains Highly Sensitive: Bullish Tone with Underlying Cautious Tensions
 Source: Bloomberg.
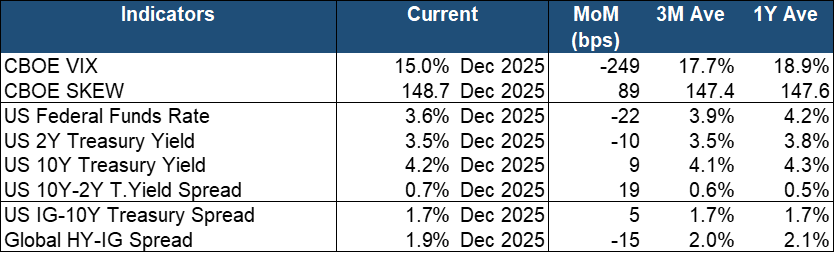
Volatility has continued to cool down in December, with the VIX falling by 249 bps MoM, quite significantly under both the Trailing 3M (~18%) and 1Y (~19%) averages. The SKEW also gone up closer to the 150 level. Both volatility indicators are still pointing to a risk-on equity market. This is likely due to the Fed’s 25 bps rate-cut in the same month.
However, we observed a twist in the yield curve with the US 2Y Treasury yield down -10 bps MoM to 3.5% while the 10Y had risen slightly by 9 bps to 4.2%, reflecting a divergence between near-term monetary policy expectations and longer-term macro risks. The decline in the 2Y yield signals growing conviction of an easing cycle over the next few years. But the uptick in the 10Y yield suggests a higher term premium to compensate for persistent fiscal deficits, elevated Treasury issuance, and uncertainty around long-term inflation and growth, even as short-term rate cut expectations firm. Overall, the 10Y-2Y spread steepened to 0.7% (19 bps MoM), an indication of a short-term bullish outlook for the bond market. In parallel, the credit markets also point to a risk-on but rates-volatile credit environment. IG–Treasury spread widening (+5 bps MoM) suggests sensitivity for rate volatility and duration exposure. However, the global high yield and investment-grade (HY–IG) spread continued to tightened (-15 bps MoM) indicates improving risk appetite and confidence in corporate credit quality.
Overall, te December rate cut spurred a risk-on environment, reflected in cooling volatility and tighter high-yield spreads. However, this bullish sentiment is complicated by a twist in the yield curve reflecting persistent long-term fiscal and inflation concerns. Investors are currently embracing risk due to cooling inflation and AI optimism but remain highly vulnerable to any inflation surprise or hawkish Fed shift that could quickly reprice both rates and equities.
Mixed Macro Backdrop: Data Gaps and Weak Growth Outlook Complicates Policy Positioning
 Source: Bloomberg.
The U.S. government shutdown earlier in Q4 disrupted key data releases, including delayed inflation, employment, and GDP reports. But the recent CPI data release has shown inflation levels moderating below the trailing 3M and 1Y levels. However, global manufacturing growth is cooling down with both the Global and Eurozone Composite PMI falling by 30 and 80 bps MoM respectively. The U.S. and manufacturing sector also continued to struggle, with the ISM Manufacturing PMI (48.7%) falling further in contractionary range, reflecting persistent weakness in factory activity and softened new orders amid higher input costs. These mixed signals will potentially contribute to a cautious central bank positioning, with policymakers wary of pre-emptive easing until disinflation is more durable and broader-based growth momentum is reaffirmed.
AI Momentum Drives Markets into 2026, but Valuation and Macro Risks Warrant Caution
As we close out 2025, our constructive medium-term market outlook remains anchored by the momentum behind the AI investment cycle and resilient corporate earnings, which have underpinned market confidence even as macroeconomic conditions remain uneven. AI-related capital expenditures continue to drive activity across semiconductors, cloud infrastructure and automation, supporting earnings and investor demand beyond the traditional mega-cap cohort, while broader sectors such as infrastructure and select industrials have also shown increased earnings contributions. Equity markets have benefited from this dynamic, with global equities delivering strong performance amid stabilizing financial conditions and moderating inflation pressures, even as interest-rate expectations have shifted and central banks tread cautiously.
However, fragile macro undercurrents persist. Valuations in leading AI beneficiaries remain stretched with a high degree of market concentration, and concerns about the sustainability of the AI rally and potential overvaluation have been highlighted by multiple strategists. At the same time, sticky inflation and central banks’ reluctance to pre-emptively ease policy underscore ongoing policy risk, while global growth signals including cooling manufacturing activity and differentiated central bank stances will temper outright optimism. Looking ahead, equity upside remains plausible, but prudence and diversification are essential. Participation in the AI-driven rally can still be rewarding, yet the balance of structural risks including valuation concentration, potential volatility around policy shifts, and geopolitical uncertainties means that a disciplined approach with broader exposure beyond U.S. mega-caps and heightened awareness of tail risks will likely serve investors well as we transition into 2026.
FIXED INCOME UPDATE
 Source: Bloomberg; Returns are presented in USD terms
 Source: Bloomberg; Returns are presented in USD terms
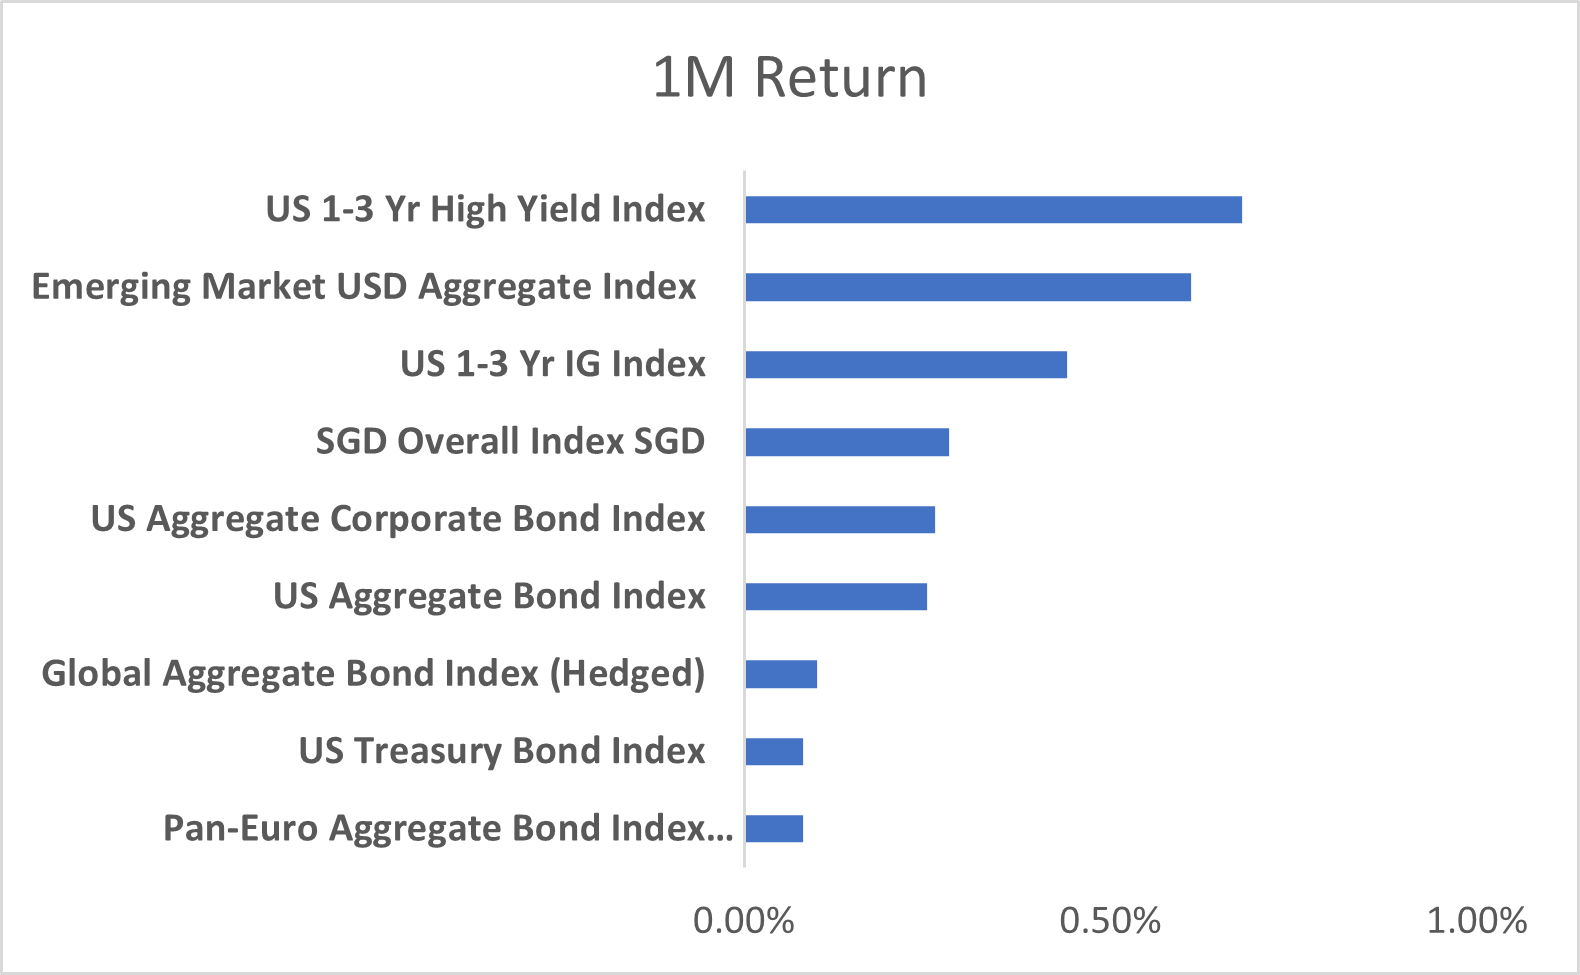
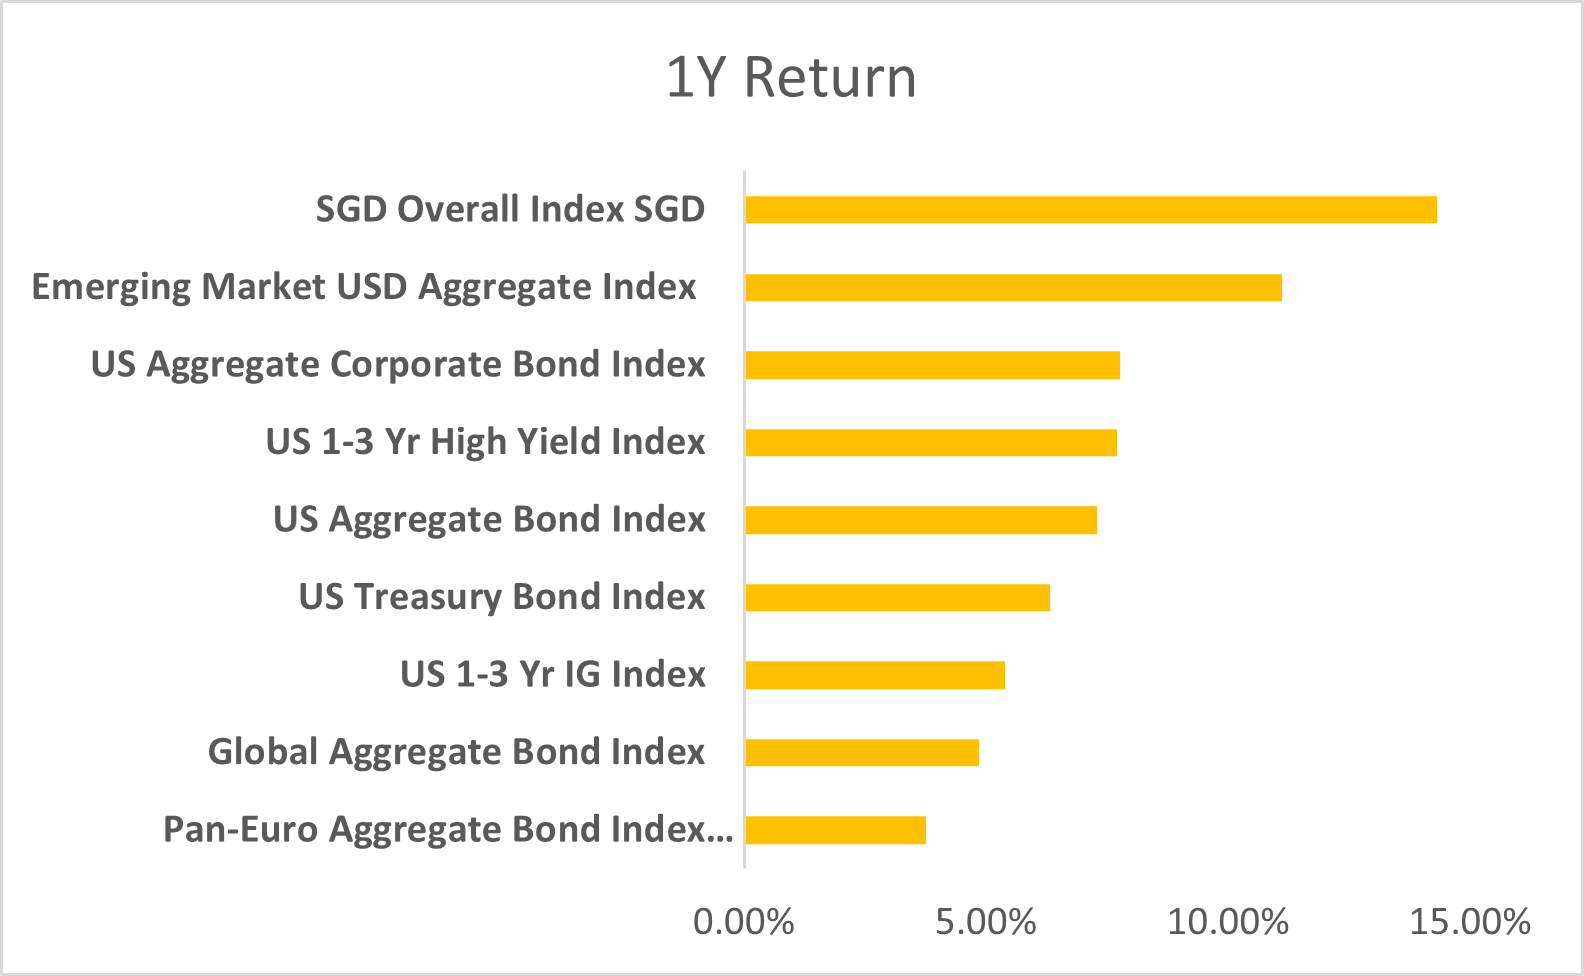
Bond markets closed the year on a positive note, with December marking another month of broad-based gains across major indices. Short-duration high yield and emerging market debt led the charge, buoyed by resilient risk sentiment and supportive macro dynamics. The US 1–3 Yr High Yield Index posted the strongest one-month return, followed closely by the EM USD Aggregate Index and US 1–3 Yr IG Index, underscoring continued investor appetite for carry and credit exposure.
The SGD Overall Index rebounded in December, reversing its recent FX-driven underperformance. While USD strength had weighed on SGD-based returns in prior months, the December recovery reflects stabilizing currency dynamics and persistent strength in domestic credit. This index ends the year as the top performer on a one-year basis, with returns approaching 15%, reaffirming the resilience of Singapore’s fixed income market amid global volatility.
US corporates delivered strong returns in 2025, driven primarily by the Fed’s pivot toward easing and the resulting price gains as yields fell. Credit spreads remained at some of their tightest levels on record, meaning corporate bonds benefited fully from the rate rally. Apart from brief volatility around Liberation Day, spreads were remarkably stable, underscoring investor confidence in fundamentals and technical support.
Emerging market debt sustained its momentum into year-end, supported by improving fundamentals, disinflation trends, and robust growth in key economies such as India and Brazil. The EM USD Aggregate Index delivered strong returns both in December and over the full year, as investors continued to diversify away from traditional dollar-denominated exposures. This secular rebalancing — driven by geopolitical hedging and structural shifts in global capital flows — has amplified cyclical tailwinds for EM credit.
European bonds were the clear laggards of 2025. The Pan Euro Aggregate Index posted the weakest returns, weighed down by a stagflationary backdrop, curve steepening, and fiscal uncertainty. Germany’s record debt budget shift, France’s repeated government collapses over debt plans, and the UK’s stretched public finances all left investor confidence fragile, with normalization in the eurozone appearing protracted.
Looking Ahead to 2026
As 2026 begins, fixed income markets are shaped by diverging expectations. Futures markets are pricing in two 25 bps cuts in 2026, while the Fed’s December dot plot signals only one, underscoring the risk of misalignment between investor positioning and policymaker guidance. If inflation proves stickier or growth more resilient, the Fed may deliver fewer cuts, pushing yields higher, steepening the curve, and strengthening the dollar. Conversely, a leadership transition at the Fed — with President Trump expected to nominate a new chair following Powell’s departure — could tilt policy more dovishly, raising the prospect of faster easing but also credibility risks if independence is questioned.
Singapore’s domestic credit fundamentals remain robust, underpinned by resilient growth — GDP expanded 4.8% in 2025, with Q4 accelerating to 5.7% on the back of a 15% surge in manufacturing. Against this backdrop, the SGD Overall Index enters 2026 with solid momentum. Rate dynamics suggest front end yields will remain anchored, supported by MAS’s steady policy stance and easing inflation, while the long end shows potential for modest steepening as growth momentum drives term premiums higher. While FX volatility may persist, disciplined issuance and regional stability continue to support performance in SGD credit markets. Investors should position for carry at the front end while monitoring steepening risks further out the curve.
US corporates enter 2026 facing a more complex backdrop. Refinancing needs will intensify, with over $1.2 trillion of maturities due by 2027, forcing issuers to navigate higher funding costs. While investment grade spreads are expected to remain anchored near historical averages, credit differentiation should sharpen as sectoral fundamentals diverge. Energy and financials may continue to benefit from resilient earnings, while consumer discretionary and real estate could face margin pressure and refinancing risk. Investors are likely to favor quality and liquidity, concentrating flows into benchmark issuers, as macro uncertainty — from slowing US growth to policy volatility — keeps risk appetite selective. The balance of carry and credit selection will be the key driver of performance in 2026
Emerging market debt remains well positioned, supported by resilient growth, improving fiscal metrics, and favourable carry profiles. Investor appetite for diversification away from traditional dollar denominated exposures continues to build, reinforcing the secular tailwinds that supported EM performance in 2025. However, geopolitical risks and idiosyncratic credit events remain key watchpoints.
Overall, 2026 opens with cautious optimism. Fixed income is shifting from a rate driven regime to one defined by credit selection, currency dynamics, and geopolitical calibration. Agility and disciplined risk management will be essential.
Important Information
This material is provided by Phillip Capital Management (S) Ltd (“PCM”) for general information only and does not constitute a recommendation, an offer to sell, or a solicitation of any offer to invest in any of the exchange-traded fund (“ETF”) or the unit trust (“Products”) mentioned herein. It does not have any regard to your specific investment objectives, financial situation and any of your particular needs. You should read the Prospectus and the accompanying Product Highlights Sheet (“PHS”) for key features, key risks and other important information of the Products and obtain advice from a financial adviser (“FA“) before making a commitment to invest in the Products. In the event that you choose not to obtain advice from a FA, you should assess whether the Products are suitable for you before proceeding to invest. A copy of the Prospectus and PHS are available from PCM, any of its Participating Dealers (“PDs“) for the ETF, or any of its authorised distributors for the unit trust managed by PCM.
An ETF is not like a typical unit trust as the units of the ETF (the “Units“) are to be listed and traded like any share on the Singapore Exchange Securities Trading Limited (“SGX-ST”). Listing on the SGX-ST does not guarantee a liquid market for the Units which may be traded at prices above or below its NAV or may be suspended or delisted. Investors may buy or sell the Units on SGX-ST when it is listed. Investors cannot create or redeem Units directly with PCM and have no rights to request PCM to redeem or purchase their Units. Creation and redemption of Units are through PDs if investors are clients of the PDs, who have no obligation to agree to create or redeem Units on behalf of any investor and may impose terms and conditions in connection with such creation or redemption orders. Please refer to the Prospectus of the ETF for more details.
Investments are subject to investment risks including the possible loss of the principal amount invested, and are not obligations of, deposits in, guaranteed or insured by PCM or any of its subsidiaries, associates, affiliates or PDs. The value of the units and the income accruing to the units may fall or rise. Past performance is not necessarily indicative of the future or likely performance of the Products. There can be no assurance that investment objectives will be achieved. Any use of financial derivative instruments will be for hedging and/or for efficient portfolio management. PCM reserves the discretion to determine if currency exposure should be hedged actively, passively or not at all, in the best interest of the Products. The regular dividend distributions, out of either income and/or capital, are not guaranteed and subject to PCM’s discretion. Past payout yields and payments do not represent future payout yields and payments. Such dividend distributions will reduce the available capital for reinvestment and may result in an immediate decrease in the net asset value (“NAV”) of the Products. Please refer to <www.phillipfunds.com> for more information in relation to the dividend distributions.
The information provided herein may be obtained or compiled from public and/or third party sources that PCM has no reason to believe are unreliable. Any opinion or view herein is an expression of belief of the individual author or the indicated source (as applicable) only. PCM makes no representation or warranty that such information is accurate, complete, verified or should be relied upon as such. The information does not constitute, and should not be used as a substitute for tax, legal or investment advice.
The information herein are not for any person in any jurisdiction or country where such distribution or availability for use would contravene any applicable law or regulation or would subject PCM to any registration or licensing requirement in such jurisdiction or country. The Products is not offered to U.S. Persons. PhillipCapital Group of Companies, including PCM, their affiliates and/or their officers, directors and/or employees may own or have positions in the Products. This advertisement has not been reviewed by the Monetary Authority of Singapore.