
Market Commentary – March 2026
EQUITY MARKET UPDATE
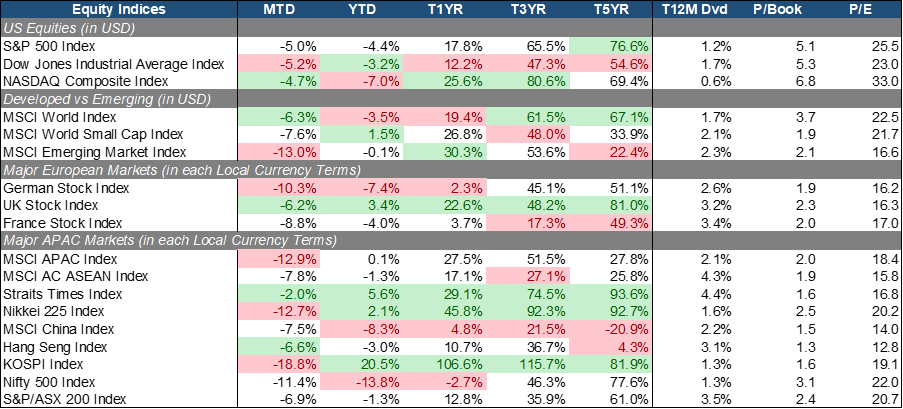
Source: Bloomberg (Total Return in USD/Local Currency terms)
The equity market broadly corrected in March 2026 as escalating geopolitical tensions surrounding the Iran conflict triggered a sharp spike in oil prices and a repricing of global inflation expectations. Concerns over potential supply disruptions, particularly through key transit routes such as the Strait of Hormuz, pushed crude prices materially higher and reinforced fears of renewed cost-push inflation. This in turn drove a hawkish reassessment of the global rate path, with markets increasingly pricing a prolonged higher-for-longer environment as central banks remain constrained in their ability to ease policy. Against this backdrop, the S&P (-5% MoM) recorded its weakest monthly performance since the 2022 bear market, reflecting broad-based de-risking and multiple compression as risk premia rose.
Both Value and Growth declined significantly, with the DJIA (-5.2% MoM) and NASDAQ (-4.7% MoM) falling in tandem. Unlike a typical rate-driven rotation where Growth underperforms, the selloff was largely macro-led and indiscriminate in nature. Elevated oil prices raised concerns over margin compression and weaker consumption, while the parallel rise in bond yields pressured equity valuations across the board. This suggested that positions unwinding and risk reductions dominated the outflows during the month, rather than a fundamental shift between style leadership.
Small Caps (-7.6% MoM) underperformed Large Caps (-6.3% MoM). Smaller companies generally face greater refinancing risks and have less pricing power to offset rising input costs, making them more vulnerable in a rising rate and inflationary environment. Emerging Market equities (13% MoM) experienced the steepest drawdowns, driven by a combination of capital outflows, currency weakness, and higher energy bills. The oil shock disproportionately impacts energy-importing economies, exacerbating external balances and weighing on investor sentiment.
In Europe, German equities (-10.3% MoM) underperformed the most, reflecting their structural exposure to energy-intensive industries and global trade. Rising energy costs and persistent weakness in the manufacturing sector compounded existing macro challenges, including soft external demand and fragile industrial activity. French equities (-8.8% MoM) remained pressured amid lingering political uncertainty following recent government instability, which continued to weigh on investor confidence and risk appetite. UK equities (-6.2% MoM) showed relative resilience, supported by their heavier weighting toward defensive sectors.
Closer to home, APAC equities declined sharply (-12.9% MoM) as the region remains highly sensitive to global trade dynamics and energy price shocks. Singapore (+2% MoM) stood out as the most resilient market, supported by its relatively benign inflation profile, stable macro outlook, and strong banking sector fundamentals, which benefit from a higher interest rate environment. China and Hong Kong (-7.5% / -6.6% MoM) also fared relatively better, underpinned by improving earnings momentum in selected sectors and ongoing policy support that helped cushion external headwinds. In contrast, South Korea (-18.8% MoM) and Japan (-12.7% MoM) were the worst-performing markets in the region, given their heavy exposure to cyclical exports, particularly semiconductors and technology hardware, which are more sensitive to global demand slowdowns and rising discount rates. Japan additionally faced pressure from higher import costs and a gradual shift in monetary policy expectations amid rising inflation linked to energy prices.
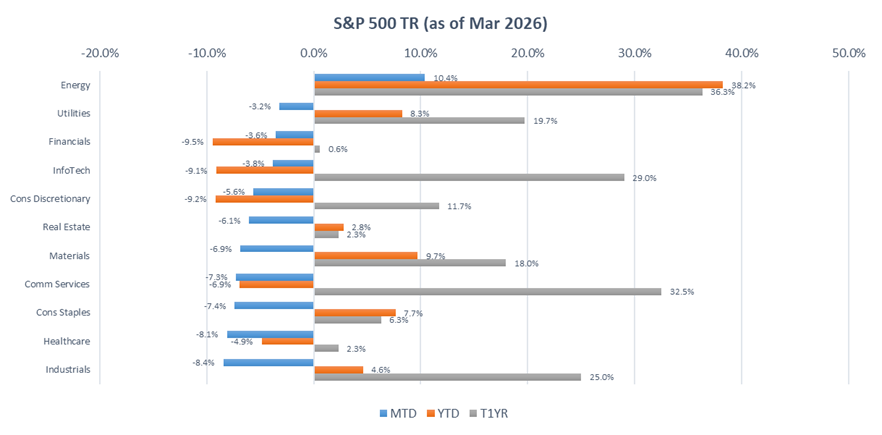 Source: Bloomberg (Total Return in USD terms)
Within the S&P 500, Energy (+10.4% MoM) was the only sector to post positive returns in March, driven by the sharp rise in oil prices amid escalating geopolitical tensions in the Middle East. Utilities (-3.2% MoM) and Financials (-3.6% MoM) also held up relatively better, reflecting a clear preference into defensive and income-generating segments as volatility picked up higher. The resilience in defensives was driven less by structural growth themes and more by capital preservation and earnings visibility amid rising macro uncertainty.
Conversely, Industrials (-8.4% MoM), Healthcare (-8.1% MoM), and Consumer Staples (-7.4% MoM) lagged the broader market. Industrials saw margins squeezed by surging energy and freight costs alongside high interest rates that dampened capital spending, while Healthcare struggled as regulatory uncertainty and rising medical costs outweighed its usual stability. Meanwhile, Consumer Staples succumbed to input cost inflation and shifting consumer habits, as the “higher-for-longer” rate environment reduced the appeal of these traditional defensive holdings.
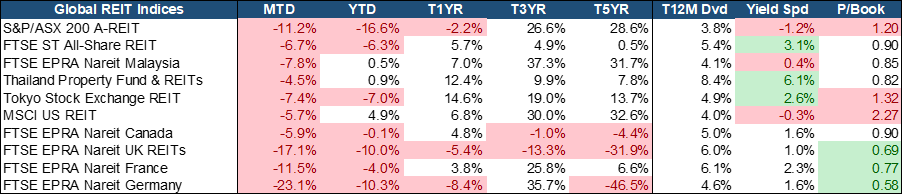 Source: Bloomberg (Total Return in Local Currency terms)
Global REITs reported negative performance across all markets in March 2026 as the Middle East conflict triggered heavy institutional selling and renewed interest rate pressure. Thailand (-4.5% MoM), the U.S. (-5.7% MoM), Canada (-5.9% MoM), and Singapore (-6.77% MoM) proved more resilient than their peers. Surging oil prices reignited inflation fears, causing the 10-year Singapore Government Bond yield to spike by 33 bps to 2.29%, which momentarily compressed the relative appeal of yield-sensitive assets.
Despite the monthly pullback, S-REITs continue to benefit from resilient fundamentals and broad-based sector strength, particularly in hospitality and industrial segments. The sector remains a compelling value play, trading at a fair 1x PB with a trailing yield spread of 2.6%, the second highest globally, as positive rental reversions in suburban retail and logistics help offset higher financing costs. The dip may be viewed as an attractive entry point for high-quality, dividend-paying assets.
EQUITY MARKET OUTLOOK
Rates Backdrop and Market Sentiment:
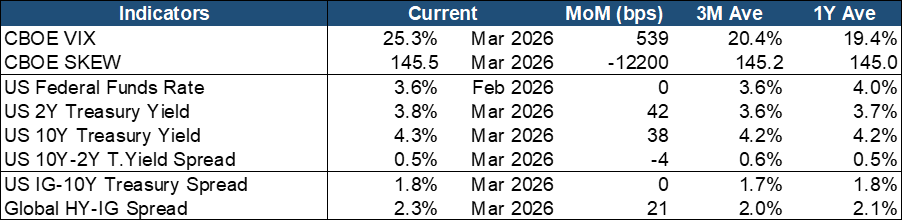 Source: Bloomberg.
Market sentiment turned risk-off with implied market volatility surging in March. The VIX rose by 539 bps MoM, crossing both the Trailing 3M (~17%) and 1Y (~19%) averages. Conversely, the SKEW Index declined but remained near short-term support levels. This flattening suggests that while immediate volatility was being priced in, investors maintained significant hedges against further left-tail risk and potential black swan events
Treasury Yields spiked by 38-44 bps MoM while the Treasury Yield Spread has fallen slightly to 0.5%. This Bear-Flattening trend was primarily driven by the geopolitical energy shock and upside inflation surprises, which forced markets to aggressively price out 2026 rate cuts in favor of a ‘higher-for-longer’ stance. This shift signaled bearish sentiment for equities as rising discount rates and the risk of stagflation weighed on growth expectations. In the credit market, the IG-Treasury spread remained unchanged, but the 21-bps widening in the HY–IG spread indicates the same risk-off sentiment, rotating away from lower-tier credits that are more vulnerable to shifting monetary policy and slowing economic momentum.
Overall, the broad-based risk-on sentiment following the December rate cut has flipped into a more selective and cautious positioning as of March 2026. While volatility spiked and the bear-flattening of the yield curve replaced previous steepening, credit markets and equity rotations indicate a complex recalibration. Investors are now prioritizing quality and resilience in anticipation of the Fed’s hawkish pause and persistent geopolitical instability.
Macroeconomic Trends and Signals:
 Source: Bloomberg.
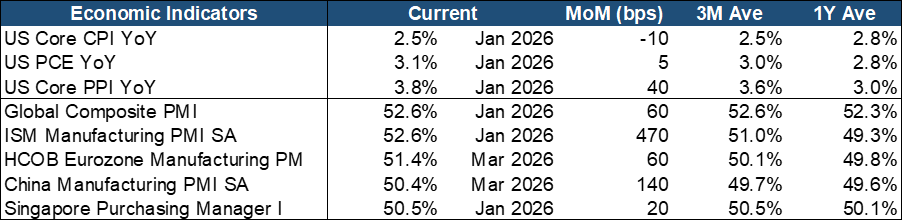
Core Inflation slightly cooled by 10 bps MoM, aligning with its 3-month average. However, the Core Personal Consumption Expenditures (PCE) gauge remained sticky at 3.1% YoY, well above the Federal Reserve’s 2% target, indicating that inflation has yet to return firmly within policy comfort levels. The Core Producer Price Index (PPI) also rose by 40 bps MoM, pointing to lingering upstream price pressures and a still-heightened inflation environment. This persistent heat led the Fed to raise its 2026 inflation forecast to 2.7% during the March FOMC meeting.
On the growth front, global manufacturing momentum is accelerating MoM, with key markets like the US (PMI: 52.6) and the Eurozone (PMI: 51.4) firmly in expansionary territory. Singapore also sustained its recovery, with its manufacturing PMI at 50.5, marking an eighth consecutive month of expansion despite a slight easing from February. This suggests that although growth is losing some steam, the broader industrial cycle has not rolled over decisively. Taken together, the combination of sticky inflation metrics and moderating but still-expanding manufacturing activity is likely to reinforce a cautious central bank stance.
Beyond the Pivot: Capturing Quality Opportunities in a High-Sensitivity, Headline-Driven Regime
The constructive momentum observed at the start of 2026 faced a sharp recalibration in March as market sentiment turned decisively risk-off. This pivot was primarily triggered by a geopolitical energy shock that saw oil prices surge, reigniting stagflation fears and forcing a market repricing of the “higher-for-longer” rate narrative. The fixed income and credit space also point to the same sentiment as the market shifted into a bear-flattening regime with a growing quality bias.
Despite the broader market drawdown, the structural AI investment cycle remains a core pillar of the industrial landscape. Global manufacturing momentum continues to accelerate with key markets remaining in expansionary territory. Higher input and freight costs will tighten margins, but the broader industrial cycle has not rolled over. Capital expenditure tied to semiconductors, data centers, and power-grid upgrades continues to provide structural earnings visibility, though leadership has narrowed as investors rotate towards crisis hedges like Energy and the defensives.
As we move into the second quarter of 2026, a disciplined and selective approach is critical. While equity upside remains plausible, elevated valuations and policy uncertainty necessitate a stance of informed prudence. The combination of sticky inflation and steady manufacturing activity will likely reinforce a cautious hawkish pause from central banks. With the Middle East conflict remaining a volatile wildcard, markets are likely to exhibit high sensitivity to both positive and negative developments. However, historical precedents suggest that initial market overreactions to geopolitical shocks often create attractive entry points for long-term equity positions. Investors should prioritize a diversified balance across regions and styles, maintaining high awareness of rate risks while seeking out beneficiaries of the ongoing Asian tech infrastructure build-out that offer a more compelling yield spread in this highly reactive market environment.
FIXED INCOME UPDATE
 Source: Bloomberg; Returns are presented in USD terms
Source: Bloomberg; Returns are presented in USD terms
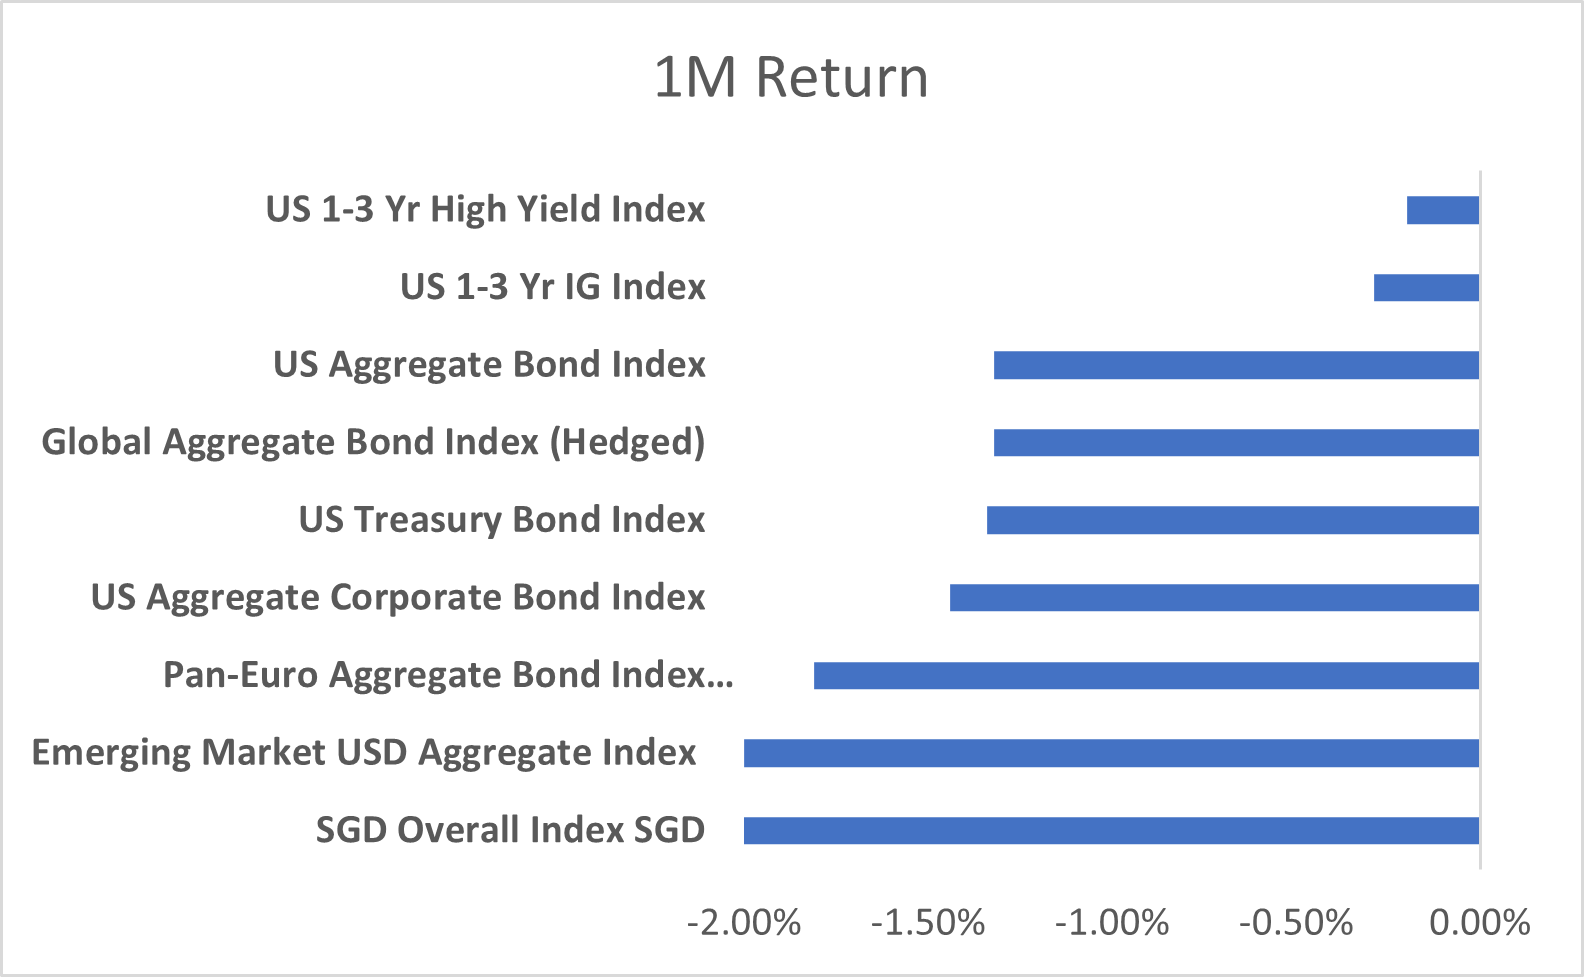
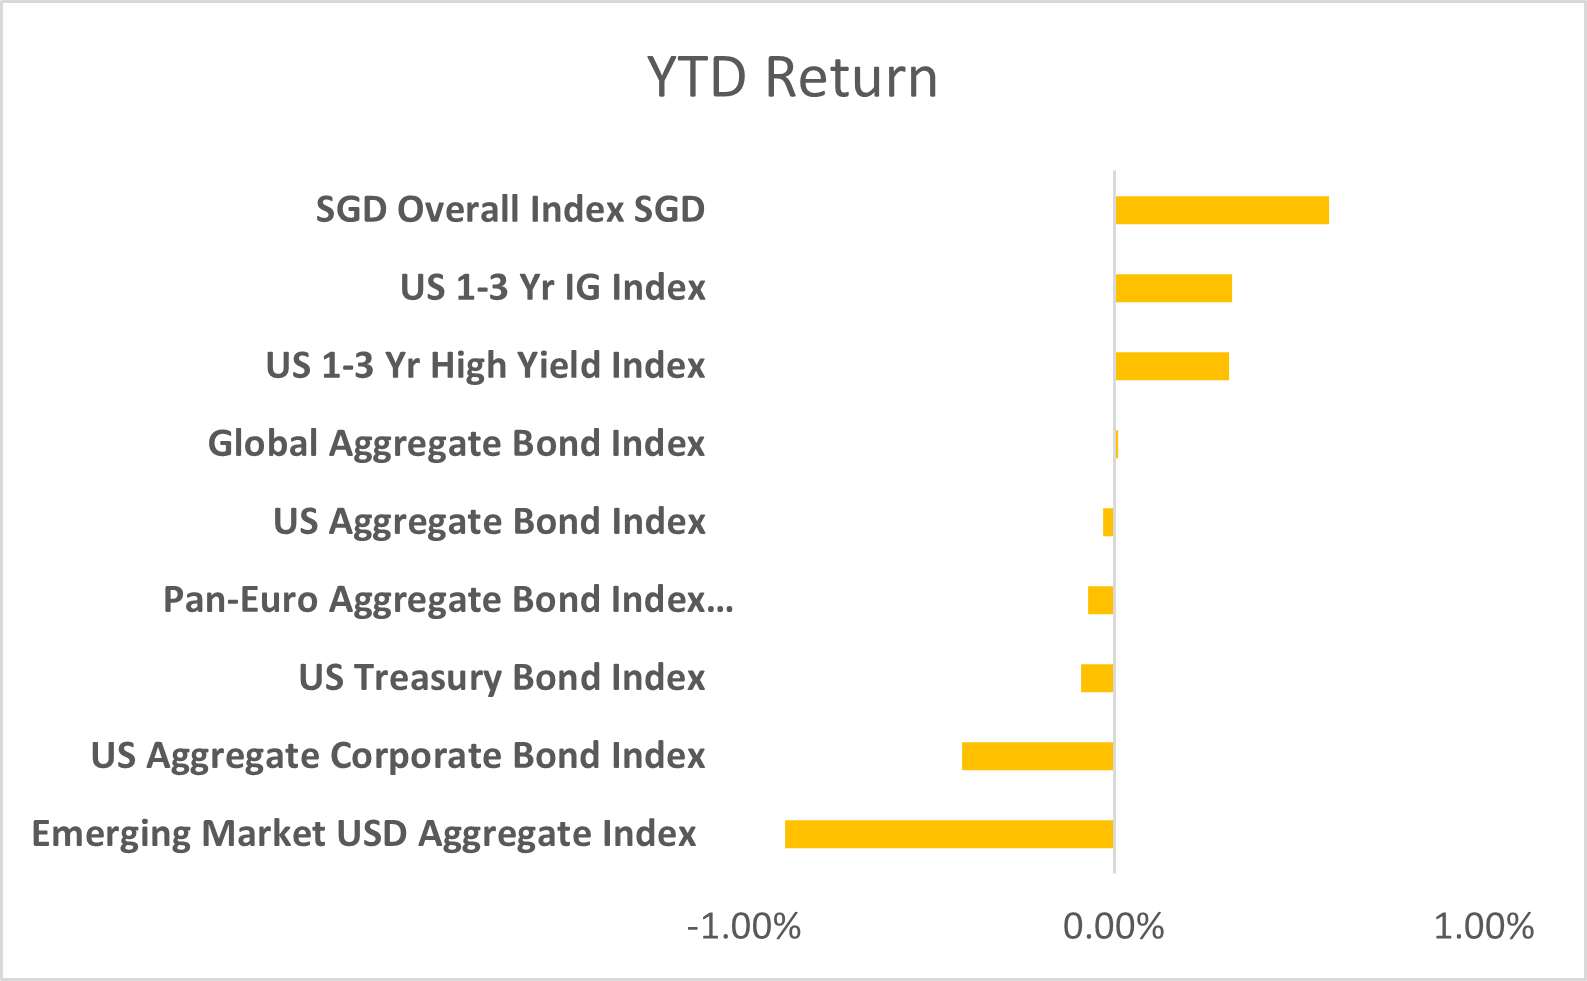
Bond markets endured a difficult March, with all major indices posting negative returns as yields rose sharply in response to the inflation shock stemming from the Iran war. The sell‑off was broad‑based, but the SGD Overall Index stood out as the worst performer in USD terms, down nearly 2% on the month. This marked a sharp reversal from its leadership earlier in the year, as the dual impact of higher global yields and a stronger USD created a double‑whammy for Singapore bonds. Even so, the SGD index remains one of the stronger performers on a YTD basis, underscoring the resilience of domestic credit fundamentals despite external headwinds.
Elsewhere, developed market indices also struggled. The US Treasury Bond Index and US Aggregate Bond Index both declined, reflecting the upward pressure on yields as investors repriced inflation risks. European bonds, which had staged a rebound earlier in the year, likewise gave back ground, with the Pan‑Euro Aggregate Index slipping into negative territory. Credit markets were not spared either, as US corporates and global aggregates posted losses, highlighting how tight spreads offered little cushion against the rate shock.
In contrast, the short‑duration space fared slightly better. While March’s performance was still negative, shorter‑dated indices such as the US 1–3 Year IG and High Yield benchmarks remain positive on a YTD basis. Their resilience reflects the lower sensitivity to duration risk in a rising yield environment, offering investors some protection against the broader sell‑off.
Geopolitical Shock: The Iran War and Bond Markets
March’s defining development was the escalation of the Iran war, which triggered a sharp inflation shock and sent global bond yields higher. Energy prices spiked, supply chain risks resurfaced, and investors quickly repriced inflation expectations. The result was a broad sell‑off across fixed income, with duration‑heavy benchmarks hit hardest.
The repricing of inflation expectations is particularly significant. Markets had entered 2026 anticipating rate cuts by mid‑year, but the war has upended that narrative. With energy costs rising and headline inflation likely to remain elevated, investors are now questioning whether the Fed can deliver any cuts at all. In fact, some are beginning to entertain the possibility of renewed rate hikes if inflation proves sticky. This shift drove yields higher across the curve as short‑dated maturities repriced to reflect policy risk, while longer‑dated bonds sold off on inflation fears and weaker demand for duration. The result was a flatter curve, signalling that markets are bracing for a higher‑for‑longer scenario with policy risk skewed toward tightening rather than easing.
The war also reinforced the USD’s safe‑haven appeal, compounding the pressure on non‑USD markets. For Singapore bonds, this created a double‑whammy: higher global yields and a stronger dollar eroded returns, turning the SGD index from YTD leader into March’s laggard. Emerging markets were similarly squeezed, as compressed spreads offered little cushion against the rate shock and currency volatility.
March’s developments underscore the importance of balancing short‑duration carry with selective duration exposure. In an environment where geopolitical shocks can rapidly reset inflation expectations and Fed policy trajectories, portfolios must remain resilient enough to capture carry, yet defensive enough to withstand renewed volatility in rates and currencies.
Important Information
This material is provided by Phillip Capital Management (S) Ltd (“PCM”) for general information only and does not constitute a recommendation, an offer to sell, or a solicitation of any offer to invest in any of the exchange-traded fund (“ETF”) or the unit trust (“Products”) mentioned herein. It does not have any regard to your specific investment objectives, financial situation and any of your particular needs. You should read the Prospectus and the accompanying Product Highlights Sheet (“PHS”) for key features, key risks and other important information of the Products and obtain advice from a financial adviser (“FA“) before making a commitment to invest in the Products. In the event that you choose not to obtain advice from a FA, you should assess whether the Products are suitable for you before proceeding to invest. A copy of the Prospectus and PHS are available from PCM, any of its Participating Dealers (“PDs“) for the ETF, or any of its authorised distributors for the unit trust managed by PCM.
An ETF is not like a typical unit trust as the units of the ETF (the “Units“) are to be listed and traded like any share on the Singapore Exchange Securities Trading Limited (“SGX-ST”). Listing on the SGX-ST does not guarantee a liquid market for the Units which may be traded at prices above or below its NAV or may be suspended or delisted. Investors may buy or sell the Units on SGX-ST when it is listed. Investors cannot create or redeem Units directly with PCM and have no rights to request PCM to redeem or purchase their Units. Creation and redemption of Units are through PDs if investors are clients of the PDs, who have no obligation to agree to create or redeem Units on behalf of any investor and may impose terms and conditions in connection with such creation or redemption orders. Please refer to the Prospectus of the ETF for more details.
Investments are subject to investment risks including the possible loss of the principal amount invested, and are not obligations of, deposits in, guaranteed or insured by PCM or any of its subsidiaries, associates, affiliates or PDs. The value of the units and the income accruing to the units may fall or rise. Past performance is not necessarily indicative of the future or likely performance of the Products. There can be no assurance that investment objectives will be achieved. Any use of financial derivative instruments will be for hedging and/or for efficient portfolio management. PCM reserves the discretion to determine if currency exposure should be hedged actively, passively or not at all, in the best interest of the Products. The regular dividend distributions, out of either income and/or capital, are not guaranteed and subject to PCM’s discretion. Past payout yields and payments do not represent future payout yields and payments. Such dividend distributions will reduce the available capital for reinvestment and may result in an immediate decrease in the net asset value (“NAV”) of the Products. Please refer to <www.phillipfunds.com> for more information in relation to the dividend distributions.
The information provided herein may be obtained or compiled from public and/or third party sources that PCM has no reason to believe are unreliable. Any opinion or view herein is an expression of belief of the individual author or the indicated source (as applicable) only. PCM makes no representation or warranty that such information is accurate, complete, verified or should be relied upon as such. The information does not constitute, and should not be used as a substitute for tax, legal or investment advice.
The information herein are not for any person in any jurisdiction or country where such distribution or availability for use would contravene any applicable law or regulation or would subject PCM to any registration or licensing requirement in such jurisdiction or country. The Products is not offered to U.S. Persons. PhillipCapital Group of Companies, including PCM, their affiliates and/or their officers, directors and/or employees may own or have positions in the Products. This advertisement has not been reviewed by the Monetary Authority of Singapore.