
Market Commentary – June 2025
EQUITY MARKET UPDATE
 Source: Bloomberg (Total Return in USD terms)
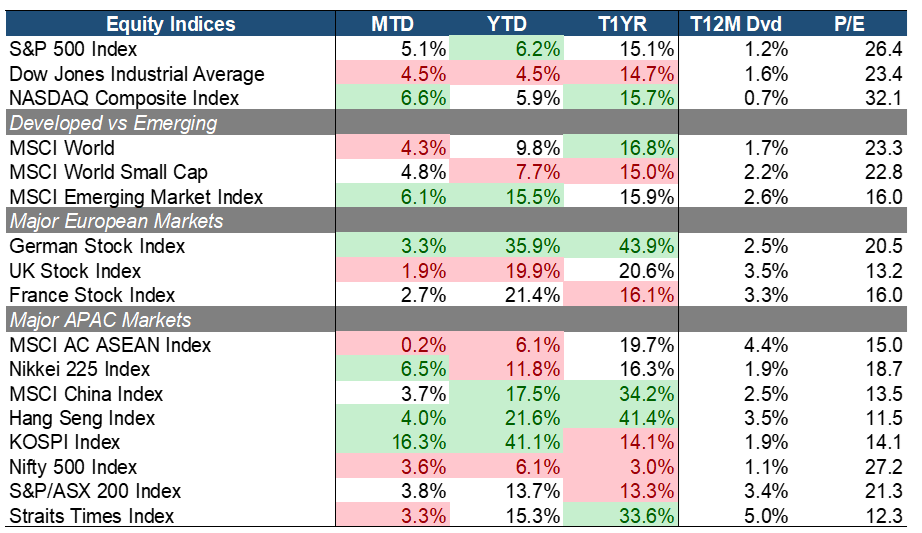
The stock market extended its rally for a second consecutive month in June, as investors grew more optimistic over the prospect of rate cuts later this year, even as stronger-than-expected jobs data and a slight rebound in inflation led the Fed to keep holding rates steady. Growth and tech stocks led the advance on the back of AI-related strength and resilient macroeconomic data. Growth stocks as loosely represented by the NASDAQ Composite posted a strong +6.6% MTD, outpacing the S&P 500 (+5.1% MTD) and the Dow Jones (+4.5% MTD). June’s gains were largely driven by mega-cap growth names and semiconductor stocks such as NVIDIA, Broadcom, and other AI-enabling names. Investor enthusiasm was fueled by expectations of accelerating enterprise AI adoption and easing long-end yields. The elevated multiples, with the S&P 500 at 23x P/E, reflect strong growth expectations.
Emerging Market equities outpaced Developed Markets, with the MSCI Emerging Markets Index rising +6.1% MTD, ahead of the MSCI World Index (+4.3% MTD). The performance gap this year has also widened (+15.5% vs +9.8% YTD). EM’s leadership was driven by strong performance in North Asia and continued capital inflows into undervalued and high-growth markets. The renewed EM momentum coincided with a softer U.S. dollar, increased policy support in China, and tariff concerns linked to U.S. elections, which shifted investor flows from U.S. equities to select EMs. Small Caps as represented by the MSCI World Small Cap Index (+4.8% MTD) have also outperformed Large Caps, supported by improving risk sentiment and aligning with the broadening trend beyond mega-cap tech names.
In Europe, returns remained positive but more muted. The German DAX gained +3.3% MTD and continues to lead YTD and T1YR performance among major European markets as its expanded spending plans and aggressive Fiscal stance fueled optimism for German Industrial equities. The UK (+1.9%) and France (+2.7%) also posted modest gains amid the ECB’s June rate cut and improving consumer sentiment, although rising inflation, the highest since Jan 2024 and weak productivity data have put some downward pressure onto UK equities.
Asia-Pacific markets delivered robust gains, led by South Korea’s KOSPI, which surged +16.3% MTD, making it Asia’s best performing market this year. The rally was powered by a sharp rebound in chip exports and rising semiconductor prices, lifting semiconductor giants like Samsung and SK Hynix. Additionally, the election of a market-friendly president, Lee Jae-myung, prompted a pro‑dividend, pro‑reform agenda, fueling investor optimism. In contrast, Singapore stocks (+3.3% MTD) relatively underperformed. The overall ASEAN markets have underperformed on mixed macroeconomic outcomes and political uncertainty. MSCI’s AC ASEAN posted flat returns amid uneven earnings and policy divergence in key markets like Thailand and Indonesia.
 Source: Bloomberg (Total Return in USD terms)
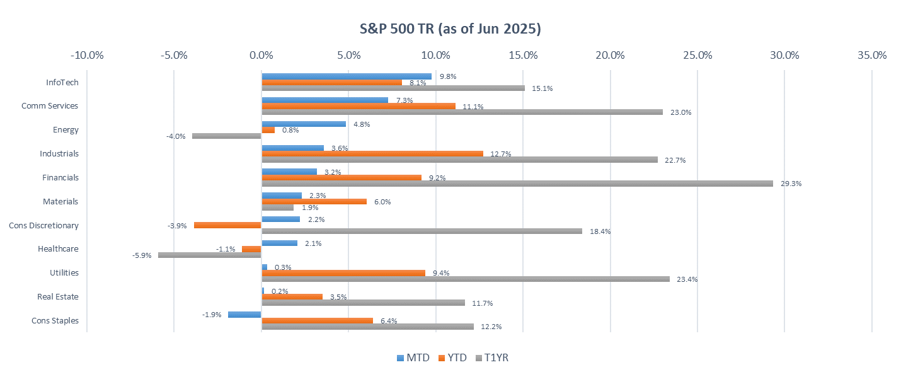
June’s market activity reflected continued investor enthusiasm for AI-driven growth, tempered by macro uncertainty in defensives and rate-sensitive areas. Growth sectors remained at the forefront, while defensive segments showed relative weakness amid shifting risk sentiment. Information Technology (+9.8% MTD) and Communication Services (+7.3% MTD) led the market, bolstered by sustained AI optimism, strong chip demand, and robust corporate spending on digital transformation. For example, NVIDIA’s record-breaking 1Q25 results and 2Q25 guidance, on top of Micron’s upbeat earnings call citing demand tailwinds in AI data center memory helped lift the sector.
On the flip side, Defensives such as Consumer Staples (–1.9% MTD), Real Estate (+0.2% MTD), and Utilities (+0.3%) relatively lagged as investors rotated out of defensives. A stronger risk-on tone and improving rate cut odds led investors to favor higher-beta exposures. While the Fed’s dovish tone in June bolstered expectations of rate cuts by 3Q25, lingering concerns around commercial real estate vacancy rates and weak fundamentals kept Real Estate subdued. Meanwhile, Utilities saw only marginal gains as capital rotated into higher-growth alternatives, with clean energy stocks showing limited participation in the broader tech rally.
 Source: Bloomberg (Total Return in USD terms)
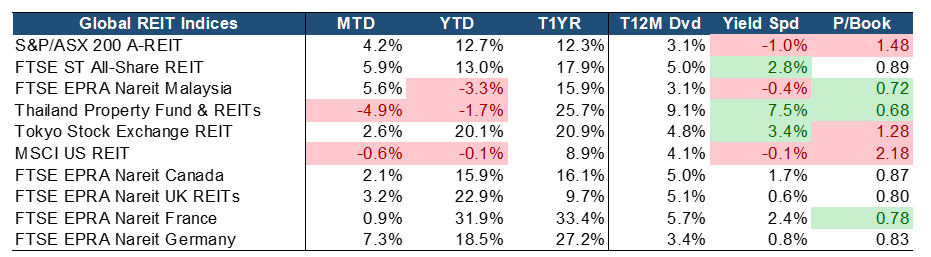
Global REITs delivered mixed performance in June, with select markets rebounding strongly following April’s broad-based correction. Top performers included Germany (+5.5% MTD), Singapore (+6.1% MTD), and Malaysia (+5.9% MTD), buoyed by renewed investor interest amid rising expectations of a September rate cut. The improving rate outlook alleviated concerns over borrowing costs and supported a rebound in asset valuations.
Valuations and yields remain attractive. Many REITs continue to trade below book value, with Price-to-Book (P/B) ratios under 1.0x. Singapore REITs (+6.1% MTD) stand out, offering a compelling 2.8% yield spread, the third-highest globally, and trading at a 0.87x P/B, reflecting both value and income potential. We maintain a constructive outlook on defensive and resilient subsectors such as Industrial and Data Center SREITs, which remain well-insulated from macroeconomic volatility. Additionally, Singapore-focused Retail and Grade-A Office REITs are well-positioned to benefit from robust domestic demand, a tight supply pipeline over the next 3-5 years, and valuation re-rating opportunities driven by current mispricing.
EQUITY MARKET OUTLOOK
Volatility Eases and Credit Spreads Tighten Amid Soft-Landing Optimism
 Source: Bloomberg.
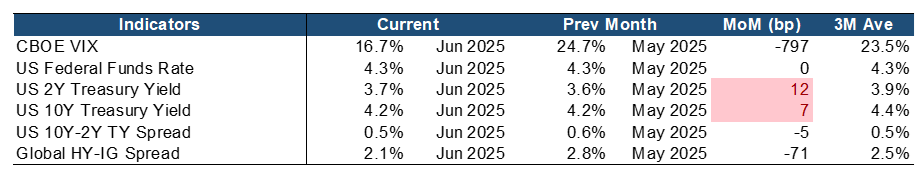
Market volatility subsided meaningfully in June, with the CBOE VIX plunging by nearly 800 bps to 16.7%, significantly below its 3-month average, signaling a return to calmer market conditions after May’s spike. Meanwhile, the Global HY-IG spread has contracted by 71 bps to 2.1%, reflecting greater investor risk appetite and tightening credit conditions. This coincided with strength in equities and overall reflected investor confidence around an imminent Fed pivot, AI-driven rally, and resilient economic prints.
The US Treasury yield curve, however, has continued its trend of Bear-Flattening as concerns over inflation and recession persist, driving both the 2‑year and 10-year Treasury yield up by 12 bps to 3.7% and by 7 bps to 4.2% respectively, decreasing the 10Y‑2Y spread to 0.5%. On a positive note, this may be a potential early pricing-in of a soft landing and eventual easing by investors.
Inflation Plateaus While Global Growth Shows Tentative Signs of Recovery
 Source: Bloomberg.
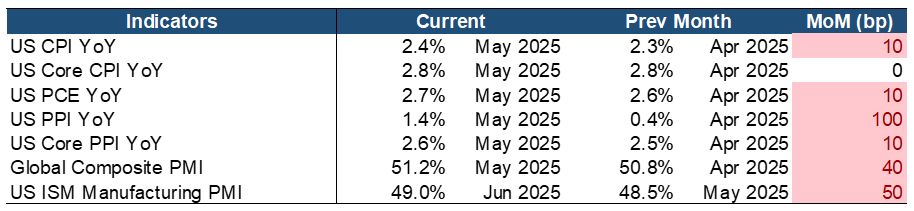
Key indicators continue to show persistent, but slightly moderating inflation. CPI and Core CPI are hanging near 2.3–2.8%. Meanwhile, the Fed’s benchmark – the PCE index- has cooled to 2.5% YoY, still hovering above its 2% target range. The leading PPI and Core PPI diverge in which producer inflation easing overall, but core pressures are building. Manufacturing activity remains weak as the ISM manufacturing PMI sank further to 48.7, the fifth straight month in contraction territory amid tariff-related disruptions. Global composite PMI also fell to 50.8, signifying global growth softness.
Key macro indicators continue to reflect persistent but manageable inflationary pressure, alongside early signs of a gradual global growth recovery. The U.S headline CPI rose slightly to 2.4% YoY (+10 bps MoM), while Core CPI remained steady at 2.8%, indicating a plateauing of underlying consumer inflation. The Fed’s preferred gauge, the Core PCE index, ticked up to 2.7% YoY (+10 bps MoM), staying notably above the 2.0% target and reinforcing the Federal Reserve’s cautious policy stance. The leading Producer Price Inflation (PPI) has also surged to 1.4% YoY (+100 bps MoM), suggesting that tariff pressures have begun to be passed down to end consumers. However, Core PPI saw only a mild uptick to 2.6%, highlighting that we might not have seen the full impact on input costs.
Encouragingly, global macro momentum showed modest improvement. The Global Composite PMI edged up to 51.2 (+40 bps MoM), staying in expansionary territory, driven by services resilience, while the ISM Manufacturing PMI improved slightly to 49.0 as well, although it remains in contraction for the fifth consecutive month, Overall, while inflation has not meaningfully reaccelerated, the lack of broad-based disinflation, coupled with resilient demand, could delay the Fed’s easing timeline. However, improving PMIs and easing credit conditions provide a constructive backdrop for risk assets heading into 2H25.
Constructive Outlook Amid Volatility, Policy Uncertainty, and Rising Political Risks
Equity markets continue to navigate a complex macro backdrop that is marked by persistent inflation, a delayed Fed pivot, geopolitical tensions, and weak industrial activity. Despite near-term uncertainty, investor sentiment has remained resilient, supported by optimism around AI-driven productivity, robust labor market data, and still-resilient consumer spending. Valuations remain attractive, with global equities trading at a modest 3–5% discount to fair value, offering selective entry opportunities for long-term investors.
Corporate earnings in 1Q25 were generally solid, led by continued strength in the technology sector, and are supported by structural growth drivers such as AI adoption, cloud infrastructure expansion, and digital automation. Market breadth has improved modestly beyond mega-cap tech, while easing credit spreads and stabilizing inflation prints provide further support. However, near-term volatility may persist due to narrowing leadership and policy ambiguity.
An additional layer of uncertainty stems from the uncertainty on the Fed’s institutional independence. Concerns have emerged that the Trump administration may pressure the Fed to cut rates more aggressively or influence monetary policy direction, which could weigh on investor confidence in long-term policy credibility. That said, if disinflation persists and macro data continues to trend favorably, the likelihood of policy easing in 2H25 should provide a supportive backdrop for risk assets over the medium to long term.
CHINA MARKET UPDATE
In June, the overall performance of A-share market was relatively strong. Among the 32 Shenwan Level-1 industries (this is a mainland industry classification system by a leading securities company), 23 recorded gains while only 9 saw slight declines, reflecting a general trend of “growth leading, consumption under pressure.”
The top five performing sectors were Telecommunications, Defense & Military, Nonferrous Metals, Electronics, and Media, with gains of 14.1%, 10.9%, 9.3%, 8.9%, and 8.4%, respectively. These sectors are primarily composed of TMT (Technology, Media, and Telecommunications) and high-end manufacturing growth assets. Their strong performance was mainly driven by positive signals from increased and constructive communication between Chinese and U.S. leaders, improved market risk appetite following China-U.S. trade talks in London, and relatively low crowding levels due to previous sector corrections.
The bottom five sectors were Food & Beverage, Personal Care, Home Appliances, Coal, and Transportation, with declines of -5.4%, -4.8%, -4.4%, -4.3%, and -1.2%, respectively. These sectors faced continued fundamental pressure, and the end of the “618” mid-year shopping festival led to a temporary decline in consumer demand, weighing on performance in June.
Overall, industry rotation was a notable feature in June, with market capital flowing selectively into growth sectors, while consumption-related and other pro-cyclical sectors saw capital outflows.
From a mid-term perspective, the market is expected to gradually rebound from the bottom, with investment opportunities continuously emerging. On the policy front, since the implementation of reciprocal tariffs, capital market policies have remained supportive. The central bank has provided relending support to Central Huijin for its purchases of index funds, helping to solidify the market bottom. With downside risks under control, investment opportunities in sectors and thematic areas have seen repeated activity, generating favorable returns and boosting market confidence. On the industrial front, although the macro environment remains subdued, China’s manufacturing sector has nurtured globally competitive industry leaders that should not be underestimated. Some industries have already entered a phase of mature and scalable growth, while others are experiencing rapid expansion after years of development — all of which present significant investment potential. On the capital front, institutional investors such as insurance funds are expected to continue increasing their allocations to equities, driven by the current “asset shortage” and supportive long-term capital entry policies. In 2025, this could bring nearly one trillion RMB in additional funding to the market, providing steady liquidity for high-dividend assets like those held by large state-owned banks, as well as for leading growth companies.
In summary, the combination of policy support, industrial advancement, and long-term capital inflows creates a threefold positive resonance. Investors may seize strategic allocation opportunities in high-quality A- and H-share assets in line with market movements.
FIXED INCOME UPDATE
 Source: Bloomberg; Returns are presented in USD terms
 Source: Bloomberg; Returns are presented in USD terms
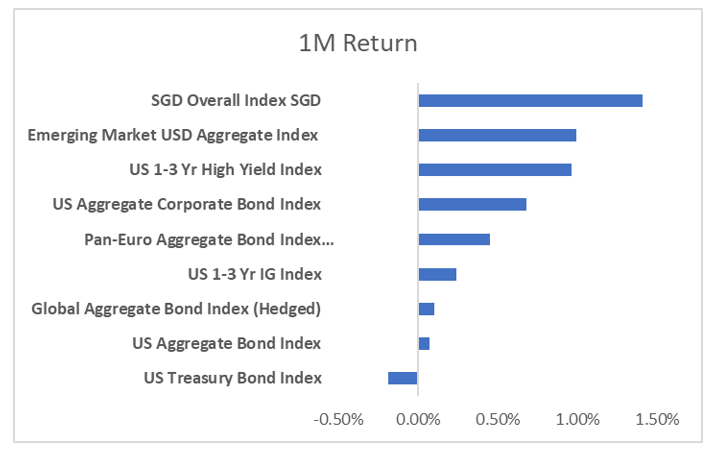
Global fixed income markets regained momentum in June, supported by easing volatility and stabilising rate expectations. Singapore bonds outshone global peers, surging nearly 3.0% for the month—more than doubling May’s gains, driven by steady yields, SGD strength, and robust demand for quality duration amid global fiscal uncertainty. The SGD’s continued to appreciate against the USD bolstered total returns and affirmed Singapore’s role a safe-haven.
Emerging market and corporate credit also rallied buoyed by softer U.S. inflation prints and signs of economic resilience across key EM economies. Tightening spreads and a subdued primary market added to the positive tone, with both the EM USD Aggregate Index and US Aggregate Corporate Bond Index both outperforming.
U.S. Treasuries recovered as long-end yields eased, reversing May’s bearish steepening. The yield curve flattened, reflecting improved auction demand and reduced term premium. This benefited rate-sensitive benchmarks, including the US Aggregate Bond Index and short-duration IG and HY indices, which continued to attract investors seeking carry without heavy duration exposure.
In contrast, European bonds lagged. The Pan-Euro Aggregate Index remained subdued amid persistent inflation pressures, sticky core inflation (notably in services), and hawkish ECB tone. The 10-year Bund yield rose modestly, ending June around to 2.59%, up from 2.51% at the start of the month, reflecting both policy uncertainty and fiscal expansion concerns in Germany, despite revised lower inflation forecasts for 2025.
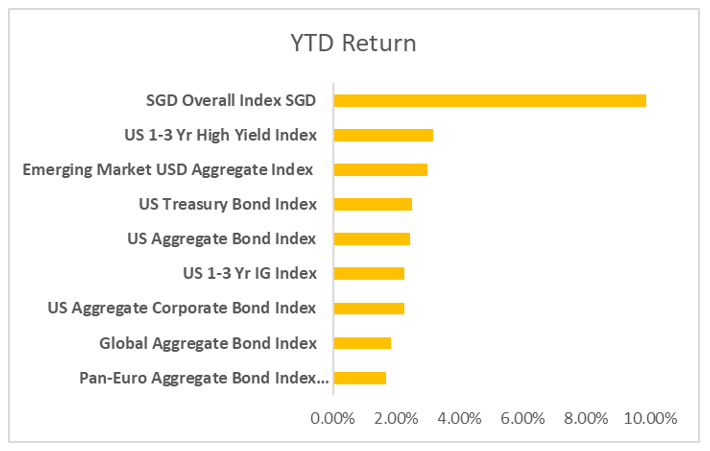
Year-to-date, SGD bonds have returned 14%, significantly outpacing global peers. This outperformance is underpinned by Singapore’s AAA-rating, MAS’s steady policy stance, currency strength, benign inflation, and limited bond issuance—positioning SGD bonds as a defensive yet rewarding allocation in a fragmented macro environment.
Fiscal Policy Takes the Spotlight in Global Bond Markets
In June 2025, global bond markets continued to be driven more by fiscal dynamics than by monetary policy. Rising debt levels, increased government spending, and growing issuance concerns are shaping investor sentiment – especially at the long end of the curve.
US Treasuries
Markets reacted more to fiscal headlines than to Fed policy. Trump’s “One Big Beautiful Bill” triggered renewed deficit concerns, and Moody’s recent downgrade of the U.S. sovereign outlook added pressure. Despite this, a strong 30-year auction mid-month offered reassurance, with long-end demand supported by pension and insurance buyers.
Germany
Bund yields stayed firm as the German government moved ahead with ambitious spending plans. Even with ECB rate cuts and cooling inflation, investor caution around supply kept yields elevated. In June, German 10-year yields edged up to 2.53%, and auction coverage ratios dipped slightly, reflecting investor caution around long-end supply.
Japan
Fiscal concerns also surfaced as parties proposed tax cuts and stimulus ahead of elections. The BOJ held rates steady but slowed its tapering of bond purchases to avoid disrupting the long-end, where yields continued to rise. The Bank of Japan held its policy rate at 0.50% in June, but long-end JGB yields remained elevated, with the 30-year yield rising more than 10bps during the month.
Key Takeaway
Investors are recalibrating for a new regime where fiscal policy—rather than just central banks —drives bond pricing. Duration strategies now require closer attention to sovereign credit risk (deficits), issuance supply dynamics, and political agendas.
Important Information
This material is provided by Phillip Capital Management (S) Ltd (“PCM”) for general information only and does not constitute a recommendation, an offer to sell, or a solicitation of any offer to invest in any of the exchange-traded fund (“ETF”) or the unit trust (“Products”) mentioned herein. It does not have any regard to your specific investment objectives, financial situation and any of your particular needs. You should read the Prospectus and the accompanying Product Highlights Sheet (“PHS”) for key features, key risks and other important information of the Products and obtain advice from a financial adviser (“FA“) before making a commitment to invest in the Products. In the event that you choose not to obtain advice from a FA, you should assess whether the Products are suitable for you before proceeding to invest. A copy of the Prospectus and PHS are available from PCM, any of its Participating Dealers (“PDs“) for the ETF, or any of its authorised distributors for the unit trust managed by PCM.
An ETF is not like a typical unit trust as the units of the ETF (the “Units“) are to be listed and traded like any share on the Singapore Exchange Securities Trading Limited (“SGX-ST”). Listing on the SGX-ST does not guarantee a liquid market for the Units which may be traded at prices above or below its NAV or may be suspended or delisted. Investors may buy or sell the Units on SGX-ST when it is listed. Investors cannot create or redeem Units directly with PCM and have no rights to request PCM to redeem or purchase their Units. Creation and redemption of Units are through PDs if investors are clients of the PDs, who have no obligation to agree to create or redeem Units on behalf of any investor and may impose terms and conditions in connection with such creation or redemption orders. Please refer to the Prospectus of the ETF for more details.
Investments are subject to investment risks including the possible loss of the principal amount invested, and are not obligations of, deposits in, guaranteed or insured by PCM or any of its subsidiaries, associates, affiliates or PDs. The value of the units and the income accruing to the units may fall or rise. Past performance is not necessarily indicative of the future or likely performance of the Products. There can be no assurance that investment objectives will be achieved. Any use of financial derivative instruments will be for hedging and/or for efficient portfolio management. PCM reserves the discretion to determine if currency exposure should be hedged actively, passively or not at all, in the best interest of the Products. The regular dividend distributions, out of either income and/or capital, are not guaranteed and subject to PCM’s discretion. Past payout yields and payments do not represent future payout yields and payments. Such dividend distributions will reduce the available capital for reinvestment and may result in an immediate decrease in the net asset value (“NAV”) of the Products. Please refer to <www.phillipfunds.com> for more information in relation to the dividend distributions.
The information provided herein may be obtained or compiled from public and/or third party sources that PCM has no reason to believe are unreliable. Any opinion or view herein is an expression of belief of the individual author or the indicated source (as applicable) only. PCM makes no representation or warranty that such information is accurate, complete, verified or should be relied upon as such. The information does not constitute, and should not be used as a substitute for tax, legal or investment advice.
The information herein are not for any person in any jurisdiction or country where such distribution or availability for use would contravene any applicable law or regulation or would subject PCM to any registration or licensing requirement in such jurisdiction or country. The Products is not offered to U.S. Persons. PhillipCapital Group of Companies, including PCM, their affiliates and/or their officers, directors and/or employees may own or have positions in the Products. This advertisement has not been reviewed by the Monetary Authority of Singapore.