
Yield curve inversion and what it means for the market
By Tan Teck Leng, Senior Fund Manager, Phillip Capital Management
An inverted yield curve is an interest rate environment in which long-term bonds have a lower yield than short-term bonds (assuming all other things are equal eg. credit quality). This type of yield curve is often considered to be a predictor of economic recession. It is the reason why markets went into some volatility recently when there was such an inversion between the 3-month US bill yield (above 2.4%) and the 10-year US Treasuries yield (below 2.4% in late March 2019).
Why is this so? Bond investors are typically considered to be savvy readers of the economy, and in a looming recession, knowing that interest rates are to trend lower, bond investors are more willing to invest in longer-term securities immediately to lock in current higher yields, hence bidding their prices and lowering their yields (yields move opposite to prices). With less demand for shorter-term bonds, their yield remains stagnant or might even go up. Hence with dropping long-term bond yields and rising short-term bond yields, this process if extended leads to an inverted yield curve.
There are a few counter-points against this to note:
- The recent inversion has happened between the three-month US bill and 10-year US bond yields. Typically, institutional investors would reference more to the 2 year-10 year yield spreads, or the 2 year-30 year yield spreads for the inversion signal.
- While an inverted yield curve is a potential indicator of upcoming recession, it is also worth noting that it may not necessarily be the case. For example, since 1954 a yield inversion of the 3-to-5 year US government yield curve has happened 73 times, while the economy has only had 9 recessions — too many false positives (Fundstrat Global Advisors, Dec 2018).
- Based on the original research case for the yield inversion as being an indicator of recession, only an inversion of at least three months is a reliable recession indicator. The inversion of the 3 month-10 year rates has actually reversed itself since late March, and we are now back to a (slight) positive yield curve again. The fact is that recent data from China (positive production and exports data) and the US (positive employment data) have revived some economic confidence once again.
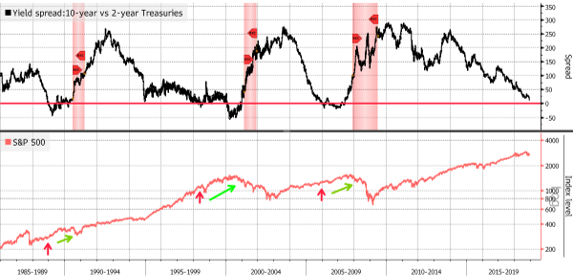
- Indeed, what we consider as the most important point is this: stocks actually still continue rising considerably after a yield curve inversion has taken place. For example, the S&P 500 has risen for over 1.5 years on average following an inversion before starting to fall, based on data since the 1950s. Another more recent case: the US yield inversion happened in early 2006, but global equity markets subsequently had one of the strongest bull markets over 2006-07 before finally peaking in late 2007.
Still, the fact is that with the US Federal Reserve halting their rate hikes, the expectation is now that the upward pressure on global interest rates is now reversing, and consensus is now tilting towards a “lower for longer” (lower growth, low interest rates) global environment in the medium term. Based on recent experience over the early 2010s when such an environment persisted, the following investment types performed well:
Bond Market Signal
Stocks have tended to keep rising after inverted yield curve
- High yield quality stocks. In a low-growth environment, income is more dependable than capital gains. High-yield equities will also be attractive given their high yield spread over risk-free rates that are expected to have peaked and heading downwards. But high yield is not good enough; the yield must also be sustainable and for that it is important to ensure that the companies behind the stocks have strong fundamentals, hence quality is important.
- An example would be the Phillip SING Income ETF. It considers company quality along two aspects: business quality and financial quality. The top constituents within this ETF comprise blue chips such as the three Singapore banks, SGX, Singtel, major REITs such as Capitaland Commercial Trust and Capitaland Mall Trust, ST Engineering and SATS.
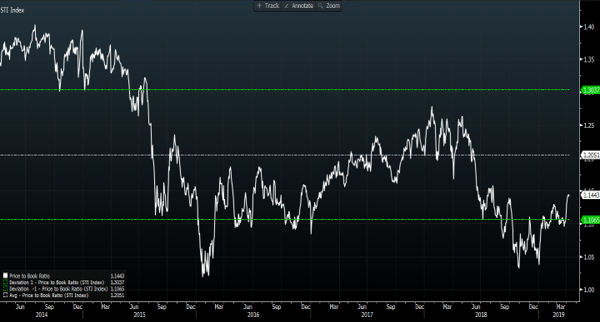
- The Singapore market has rallied lows already in 2019, but in terms of valuation it is still attractive when compared to its own history. For example, on a price-book basis, the benchmark Singapore stock index is still trading at 0.5X standard deviations below 5-yr average. See below:
- REITs. Property is also one of the sector beneficiaries from declining rates. In particular, REITs will be attractive in such a “lower for longer” environment given their high dividend yields. REITs benefit from lower interest rates fundamentally because they will be able to finance properties at lower interest rates going forward. In times of uncertainty, REITs also enjoy resilience given their locked-in leases (eg. industrial REITs can be 5 years or longer, retail and office leases around 2-3 years) which ensures steady cashflow as long as tenants do not default.
- For example, the Phillip SGX APAC Dividend Leaders REIT ETF, investing in Asia-Pacific REITs, has delivered 13.4% total return in 2019 already, while the Singapore focused Lion-Phillip S-REIT ETF has delivered 12.5% over the same period (all in SGD terms). That is not all: in a bad year for equities such as 2018, the former only dropped 3.0% while the latter declined a modest 5.4%.
—
Important Information
This material and the information herein is provided by Phillip Capital Management (S) Ltd (“PCM”) for general information only and does not constitute a recommendation, an offer to sell, or a solicitation of any offer to invest in the product (“REITs ETF”) mentioned herein. It does not have any regard to your specific investment objectives, financial situation and any of your particular needs. The information is subject to change at any time without notice. The value of the units and the income accruing to the units may fall or rise. You should read the Prospectus and the accompanying Product Highlights Sheet(“PHS”) for disclosure of key features, key risks and other important information of the REITs ETF and obtain advice from a financial adviser (“FA”) before making a commitment to invest in REITs ETF. In the event that you choose not to obtain advice from a FA, you should assess whether the REITs ETF is suitable for you before proceeding to invest. A copy of the Prospectus and PHS are available from PCM or any of its Participating Dealers (“PDs”). The REITs ETF is not like a typical unit trust as it is intended for the units of the REITs ETF (the “Units”) to be listed and traded like any share on the Singapore Exchange Securities Trading Limited (“SGX-ST”). Listing on the SGX-ST does not guarantee a liquid market for the Units which may be traded at prices above or below its net asset value (“NAV”) or may be suspended or delisted. Investors may buy or sell the Units on SGX-ST when it is listed. Investors cannot create or redeem Units directly with PCM and have no rights to request PCM to redeem or purchase their Units. Creation and redemption of Units can be done through PDs if investors are clients of the PDs, who have no obligation to agree to create or redeem Units on behalf of any investor and may impose terms and conditions in connection with such creation or redemption orders. Please refer to the Prospectus for more details. Investments are subject to investment risks including the possible loss of the principal amount invested, and are not obligations of, deposits in, guaranteed or insured by PCM or any of its subsidiaries, associates, affiliates or PDs. Past performance is not necessarily indicative of the future or likely performance of the REITs ETF. There can be no assurance that investment objectives will be achieved. The regular dividend distributions, either out of income and/or capital, are not guaranteed and subject to PCM’s discretion. Such dividend distributions will reduce the available capital for reinvestment and may result in an immediate decrease in the NAV of the REITs ETF. Past payout yields (rates) and payments do not represent future payout yields (rates) and payments. Please refer to www.phillipfunds.com for more information in relation to the dividend distributions. Any use of financial derivative instruments will be for hedging and/or for efficient portfolio management. PCM reserves the discretion to determine if currency exposure should be hedged actively, passively or not at all, in the best interest of the REITs ETF. The information does not constitute, and should not be used as a substitute for tax, legal or investment advice. PhillipCapital Group of Companies, including PCM, their affiliates and/or their officers, directors and/or employees may own or have positions in the investments mentioned herein or related thereto. This information herein are not for any person in any jurisdiction or country where such distribution or availability for use would contravene any applicable law or regulation or would subject PCM to any registration or licensing requirement in such jurisdiction or country. The REITs ETF is not offered to U.S. Persons. The information provided herein is based on certain information, conditions and/or assumptions available as at the date of this publication that may be obtained, provided or compiled from public and/or third party sources which PCM has no reason to believe are unreliable; and may contain optimistic statements/opinions/views regarding future events or future financial performance of countries, markets or companies. Any opinion or view herein is an expression of belief of the individual author or the indicated source (as applicable) only. PCM makes no representation or warranty that such information is accurate, complete, verified or should be relied upon as such. You must make your own financial assessment of the relevance, accuracy and adequacy of the information in this factsheet. Accordingly, no warranty whatsoever is given and no liability whatsoever is accepted for any loss or consequences arising whether directly or indirectly as a result of your acting based on the Information in this factsheet. The SGX APAC Ex-Japan Dividend Leaders REIT Index and SGX Mark is a trade mark and is used under licence from Singapore Exchange Limited and/or its affiliates. All copyrights and database rights in the SGX APAC Ex-Japan Dividend Leaders REIT Index belongs exclusively to SGX and/or its affiliates and are used herein under licence. Phillip Capital Management is solely liable and responsible for the Phillip SGX APAC Dividend Leaders REIT ETF. Each of Singapore Exchange Limited and its affiliates takes no position on the purchase or sale of the Phillip SGX APAC Dividend Leaders REIT ETF and expressly disclaims any and all guarantees, representations and warranties, expressed or implied, and shall not be responsible or liable (whether under contract, tort (including negligence) or otherwise) or any loss or damage of any kind (whether direct, indirect or consequential losses or other economic loss of any kind) suffered by any person in relation thereto. Morningstar® Singapore Yield Focus IndexSM are service marks of Morningstar Research Pte Ltd and its affliated companies (collectively, “Morningstar”) and have been licensed for use for certain purposes by PCM. Phillip SING Income ETF is not sponsored, endorsed, sold or promoted by Morningstar, and Morningstar makes no representation regarding the advisability of investing in Phillip SING Income ETF. This material has not been reviewed by the Monetary Authority of Singapore.