
CY2020 Review of Phillip SGX APAC Dividend Leaders REIT ETF
The COVID-19 pandemic has brought about massive market dislocations and uncertainties. REITs, as a whole, have shown resiliency in face of the pandemic in 2020. Our ETF that invests in regional REITs, the Phillip SGX APAC Dividend Leaders REIT ETF (“the Fund”) posted a Net Total Return (“NTR”) of -4.82% in the calendar year (“CY2020”) for its units that are trading in USD, versus the benchmark iEdge APAC Ex-Japan Dividend Leaders REIT (USD) index NTR of -1.82%. The Fund posted an NTR of -6.42% for its units that are trading in SGD.
By individual REIT markets, the Singapore Exchange (“SGX”) iEdge S-REIT index delivered a performance of -2.98%, while Australia Securities Exchange (“ASX”)200 A-REIT index was down -5.56% and Hang Seng (“HSI”) REIT index posted -13.46% in the comparable period.[1] For this CY2020 review of Phillip SGX APAC Dividend Leaders REIT ETF, we look into the major property markets by allocation (Hong Kong and Australia) and offer our insights. For the review of the Singapore property market and the S-REIT space, please read the article titled “CY2020 Review of Phillip Singapore Real Estate Income Fund”.
Hong Kong Property Market
Chart 1: Property and Rental Price Indexes by Types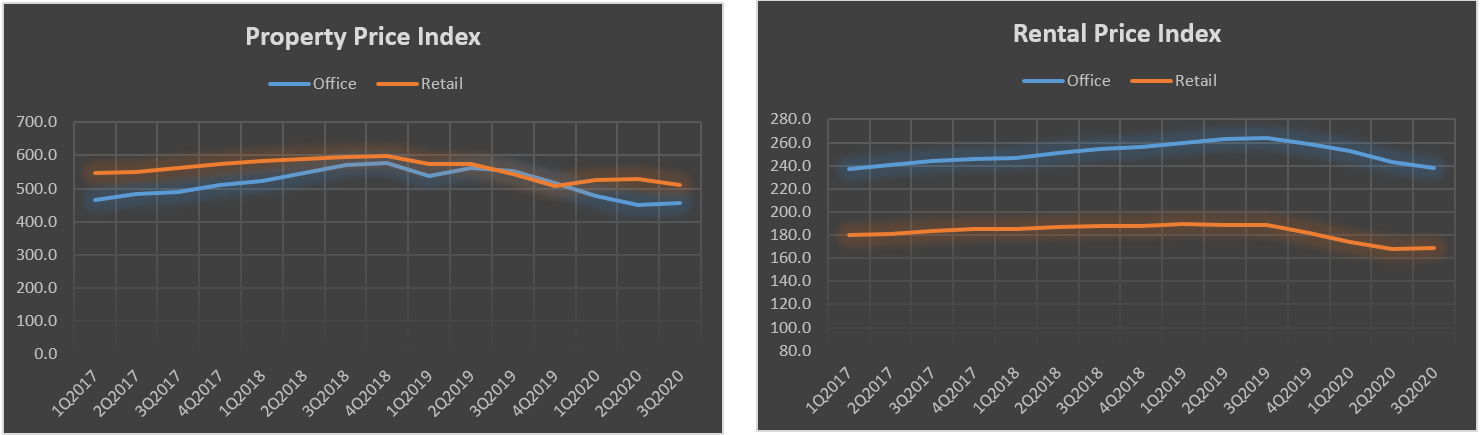 Source: Ratings and Valuation Department (“RVD”) of The Government of Hong Kong SAR; 1999 Base Reference Price = 100. Refer to Table 1 for full data and RVD for index methodology
The Hong Kong Property Market is impacted more severely in recent quarters, plagued by social unrest in 2019 and the pandemic in 2020. Property and rental prices in Hong Kong had been trickling down more disproportionately compared to others in the region. This phenomenon is also reflected in Hong Kong REITs underperformance relative to peers in the APAC region.
Figures from the RVD as of 3Q2020 showed that private offices saw prices plunged 11.65% since the start of the pandemic year, while the private retail space prices were more resilient and in fact risen marginally by 0.73%. On the rental aspect, Hong Kong saw rental rates declined 8% in the office space and 7% in the retail space. Consequently, property market yield for Grade A Office rose 0.3 percentage points from end of 4Q2019 to 2.9% per annum (“p.a.”) at end of 3Q2020. At the same time, the property market yield for retail properties declined slightly by 0.1 percentage points to 2.6% (see Chart 1 and Table 1).
Compared to Singapore that sped up the rollout of the vaccines, Hong Kong’s delay in its vaccination would act as potential headwinds for its economy to put downward pressure on property rent rates and prices in the near-term. However, a limited new supply added through in 2020 should help in alleviating the dynamics in Hong Kong’s property market (see Table 1A and 1B).
With the rest of the world’s economy faltering into recessions, Hong Kong may lean into China which is largely expected to churn positive gross domestic product (“GDP”) growth forecasted to come in at 2.1% for 2020. In our view, having past the peak of the National Security Law implementation period, a “China hinterland” could be a significant driver in Hong Kong economic recovery.
As global aviation ground to a halt last year, Hong Kong saw inbound tourist figures plunged 94% from the start to November 2020. Pre-pandemic, Chinese visitors made up more than 78% of total inbound numbers in 2019, where total tourism expenditure receipts associated with all inbound tourists amounting to HK$256.2 billion. As such, the return of Mainland Chinese visitors would be a critical driver to watch for.
Table 1: Property Price and Rental Price Indices for Office and Retail Space (Overall)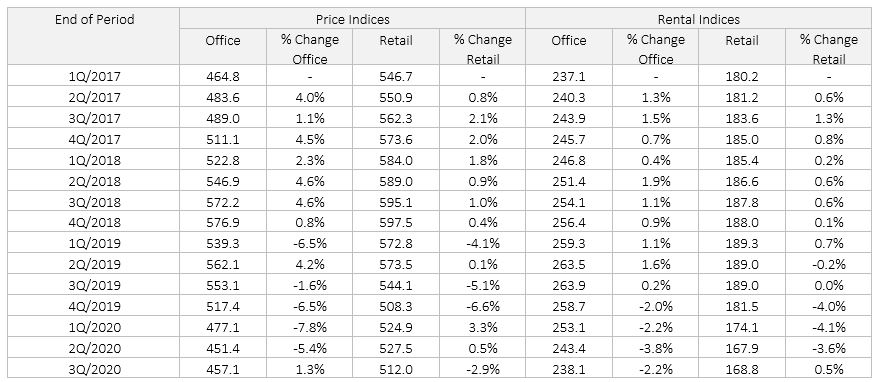
Table 1A: Completions of Office Properties in Hong Kong by Grade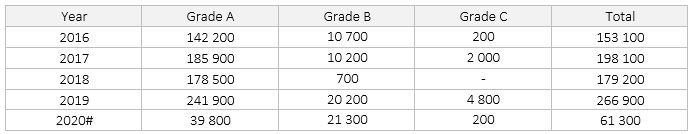
Table 1B: Completions, Stock, Vacancy of Retail Properties in Hong Kong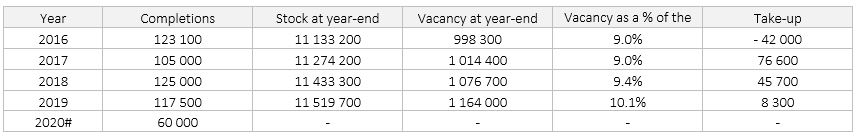 Table 1A,1B Source: RVD; in meter square
#Provisional figures (up to 30.11.2020)
Australia Property Market
Over in Australia, the COVID-19 pandemic similarly accelerated the de-rating of malls and offices for most of 2020. However, our research from various industry sources seems to suggest some indications that the Australia property market is rebounding amidst a more hopeful outlook in 2021.
Chart 2: Asking Price Index (“API”) of Rent by Types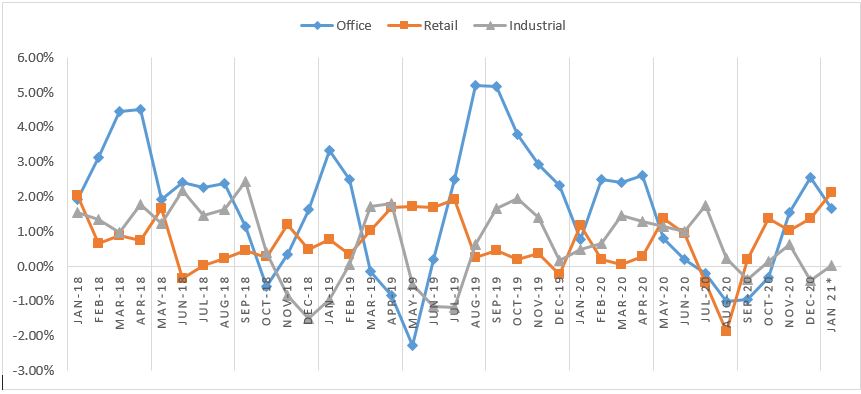 Source: Phillip Capital Management (“PCM”); data from Commercial Property Guide (Australia). Refer to Table 2 for full data
The API by Commercial Property Guide (Australia) tracks the monthly change in vendor sentiment in rental properties in Australia. It represents the industry’s opinion and hence a forward-looking indicator to the future direction of Australia’s commercial real estate price movements. From Chart 2, API for rental rates for Australia’s retail and office sectors have rebounded and trended higher since August 2020. Meanwhile, the industrial sector had remained largely flat, largely due to the resilience of the sector despite the pandemic.
Chart 3: Year-on-year change in searches for properties for lease (commercial)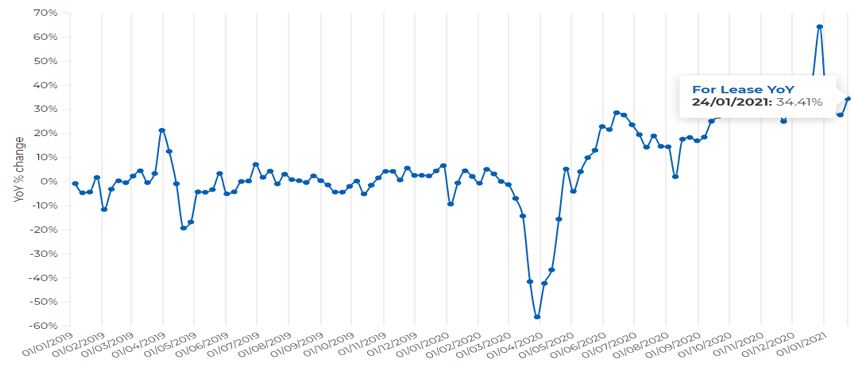
Source: realcommercial.com.au; week ending as of 24 January 2021.
In the office sector, industry sources (Chart 3) also showed that recent weekly searches for lease have been spiking, corresponding with our view that demand for office space in Australia is likely to be recovering. We believe this is led by greater expectations for increased workplace ratios owing to the vaccine roll-outs.
Another positive indication is drawn from Australia’s residential market: As of the end of September 2020, home prices in 8 major cities in Australia soared 4.5% on a weighted average basis, compared to a year ago. A buoyant residential demand is typically suggestive of strong consumer sentiments. We expect the recovery in consumption spending would lead translate to net absorptions for other property types down the road.
Table 2: Asking Price Index (“API”) of Rent by Type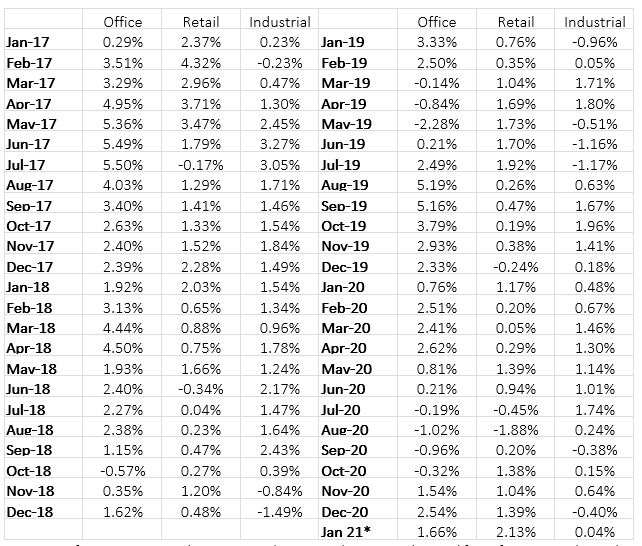 Source: Refer to commercialpropertyguide.com.au/resources/cpg-ai/ for information about the index
Table 3: Residential Property Price Indexes: Eight Capital Cities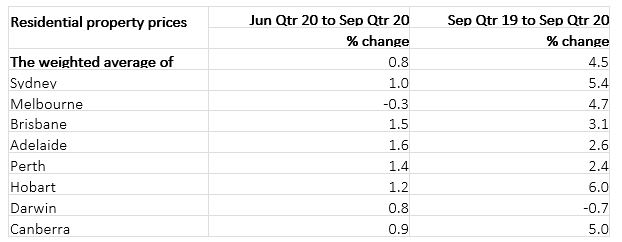 Source: Australia Bureau of Statistics; as of end of September 2020
Updates on Phillip SGX APAC Dividend Leaders REIT ETF
Chart 4: Portfolio Allocation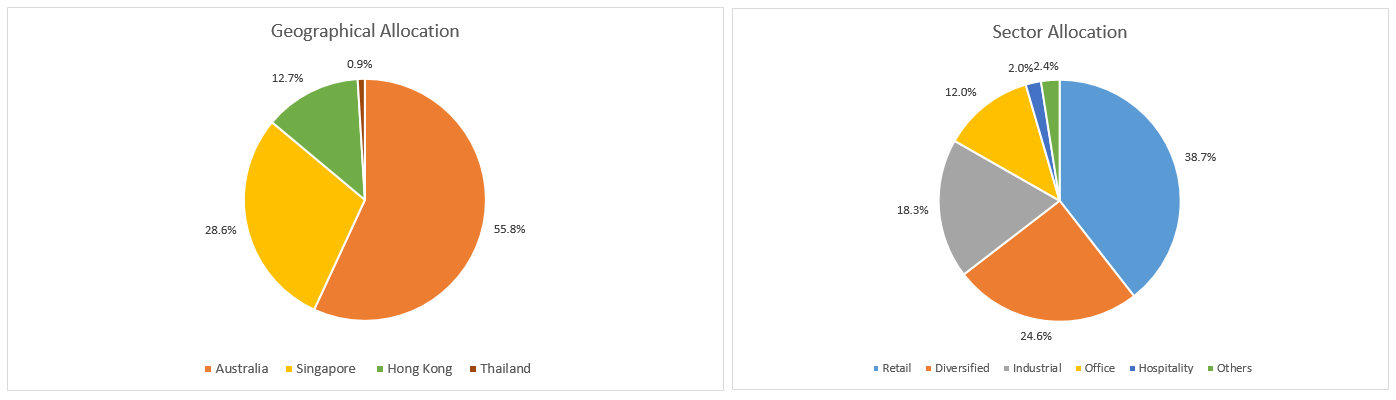 Source: PCM; as of 31 December 2020
Compared to 1H2020, Phillip SGX APAC Divdend Leaders REIT ETF ended CY2020 with higher allocation in Australia at 55.8% [+5.3%], whilst lower allocation in Singapore at 28.6% [-6.2%], Hong Kong at 12.7% [-0.4%] and Thailand at 0.9% [-0.4%]. Sectorally, the Fund increased its allocation into Retail to 38.7% [+1.7%], Diversified REITs to 24.6% [+1.8%], Hospitality to 2.0% [+0.3%] and Others to 2.4% [0.9%], while allocation into Industrial sector was trimmed to 18.3% [-4.0%] and Office sector to 12.0% [-2.4%].
Dividend-wise, Phillip SGX APAC Dividend Leaders REIT ETF’s rolling 12-month distribution was US$0.0273 per unit for CY2020. Based on the NAV per unit of US$1.036 as of 31 December 2020, the trailing 12-month dividend yield would work out to be around 2.64%.
Table 4: Constituents Metrics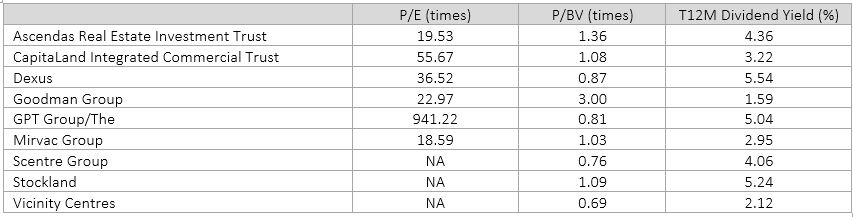 Source: PCM; Bloomberg as of 31 December 2020.
[1] Source: S&P Global Indices, Hang Seng Indexes, Singapore Exchange (respectively)
Important Information
This publication and the information herein is provided by Phillip Capital Management (S) Ltd (“PCM”) for general information only and does not constitute a recommendation, an offer to sell, or a solicitation of any offer to invest in the product (“REITs ETF”) mentioned herein. It does not have any regard to your specific investment objectives, financial situation and any of your particular needs. The information is subject to change at any time without notice. The value of the units and the income accruing to the units may fall or rise. You should read the Prospectus and the accompanying Product Highlights Sheet(“PHS”) for disclosure of key features, key risks and other important information of the REITs ETF and obtain advice from a financial adviser (“FA”) before making a commitment to invest in REITs ETF. In the event that you choose not to obtain advice from a FA, you should assess whether the REITs ETF is suitable for you before proceeding to invest. A copy of the Prospectus and PHS are available from PCM or any of its Participating Dealers (“PDs”). The REITs ETF is not like a typical unit trust as it is intended for the units of the REITs ETF (the “Units”) to be listed and traded like any share on the Singapore Exchange Securities Trading Limited (“SGX-ST”). Listing on the SGX-ST does not guarantee a liquid market for the Units which may be traded at prices above or below its net asset value (“NAV”) or may be suspended or delisted. Investors may buy or sell the Units on SGX-ST when it is listed. Investors cannot create or redeem Units directly with PCM and have no rights to request PCM to redeem or purchase their Units. Creation and redemption of Units can be done through PDs if investors are clients of the PDs, who have no obligation to agree to create or redeem Units on behalf of any investor and may impose terms and conditions in connection with such creation or redemption orders. Please refer to the Prospectus for more details. Investments are subject to investment risks including the possible loss of the principal amount invested, and are not obligations of, deposits in, guaranteed or insured by PCM or any of its subsidiaries, associates, affiliates or PDs. Past performance is not necessarily indicative of the future or likely performance of the REITs ETF. There can be no assurance that investment objectives will be achieved. The regular dividend distributions, either out of income and/or capital, are not guaranteed and subject to PCM’s discretion. Such dividend distributions will reduce the available capital for reinvestment and may result in an immediate decrease in the NAV of the REITs ETF. Past payout yields (rates) and payments do not represent future payout yields (rates) and payments. Please refer to www.phillipfunds.com for more information in relation to the dividend distributions. Any use of financial derivative instruments will be for hedging and/or for efficient portfolio management. PCM reserves the discretion to determine if currency exposure should be hedged actively, passively or not at all, in the best interest of the REITs ETF. The information does not constitute, and should not be used as a substitute for tax, legal or investment advice. PhillipCapital Group of Companies, including PCM, their affiliates and/or their officers, directors and/or employees may own or have positions in the investments mentioned herein or related thereto. This information herein are not for any person in any jurisdiction or country where such distribution or availability for use would contravene any applicable law or regulation or would subject PCM to any registration or licensing requirement in such jurisdiction or country. The REITs ETF is not offered to U.S. Persons. The information provided herein is based on certain information, conditions and/or assumptions available as at the date of this publication that may be obtained, provided or compiled from public and/or third party sources which PCM has no reason to believe are unreliable; and may contain optimistic statements/opinions/views regarding future events or future financial performance of countries, markets or companies. Any opinion or view herein is an expression of belief of the individual author or the indicated source (as applicable) only. PCM makes no representation or warranty that such information is accurate, complete, verified or should be relied upon as such. You must make your own financial assessment of the relevance, accuracy and adequacy of the information in this publication. Accordingly, no warranty whatsoever is given and no liability whatsoever is accepted for any loss or consequences arising whether directly or indirectly as a result of your acting based on the Information in this publication. Index and SGX Mark is a trade mark and is used under licence from Singapore Exchange Limited and/or its affiliates. All copyrights and database rights in the Index belongs exclusively to SGX and/or its affiliates and are used herein under licence. Phillip Capital Management is solely liable and responsible for the ETF. Each of Singapore Exchange Limited and its affiliates takes no position on the purchase or sale of such ETF and expressly disclaims any and all guarantees, representations and warranties, expressed or implied, and shall not be responsible or liable (whether under contract, tort (including negligence) or otherwise) or any loss or damage of any kind (whether direct, indirect or consequential losses or other economic loss of any kind) suffered by any person in relation thereto. This publication has not been reviewed by the Monetary Authority of Singapore.