
CY2020 Review of Phillip Singapore Real Estate Income Fund
In face of one of the worst years for Singapore equities in the year 2020 (“CY2020”), S-REITs emerged with highly resilient performance. Along with consensus earnings being slashed, the local bourse ended the year being one of the region’s worst performers, with the Straits Times Index (“STI”) posting a Net Total Return (“NTR”) of -8.1%. When compared to the STI, S-REITs’ performance would be highly respectable, with the SGX iEdge S-REIT NTR index returning -2.98% during the same comparable period.
During the time, our active S-REIT fund Phillip Singapore Real Estate Income Fund (“PSREIF”) delivered an NTR of -5.39%, underperforming the SGX iEdge S-REIT NTR benchmark index. The underperformance can be attributed to underweight towards the Industrial REITs segment relative to the index, as well as cash drag due to fund inflows. For the year, asset-under-management (“AUM”) of PSREIF grew 8.5% to close at $61.6 million, representing a net inflow of $7.9 million.
Dividend-wise, PSREIF announced a $0.014 distribution payout per unit on 6 January 2021, to bring the rolling twelve-month distribution to $0.0675 per unit. At the Net Asset Value of $1.3041 as of 31 December 2020, the trailing twelve-month dividend yield would work out to be 5.17%.
Singapore Property Market Outlook in 2021
The early stringent containment measures implemented by the Singapore Government last year, though a tough pill to swallow, had turned out to be a strategic success in stamping out local infection rate. Coupled with the early adoption and rollout of the vaccines by the Singapore Government, as well as the Phase 3 reopening that only went into effet end-December last year, we expect to see continued economic momentum domestically.
On the macro level, policies – both fiscal and monetary – are expected to remain supportive to sustain the economic recovery that is underway. Meanwhile, a concerted fiscal injection by governments around the world would also benefit export-oriented economies like Singapore. Combining these favourable conditions with the undemanding valuations and compelling dividend yields of S-REITs in circumspect to the low-interest rate environment, valuations of S-REITs have room to re-rate higher.
That said, the recovery of S-REITs will also be met with some headwinds, along with the uncertainties of how the pandemic could transpire. Even then, across the S-REIT sectors, recovery will not be even. This due to the much larger pipeline of new supply that will be added into the mix across the sectors in 2021 compared to 2020.
On the whole, we are overweight in the retail sector to ride on the recovery of discretionary spending by consumers, as well as the industrial sector due to the tightening demand-supply dynamics. On the other hand, we are underweight on the office and hospitality sectors due to significantly larger new supplies, high vacancy rates and uncertainties relating to when a higher level of business or travel activities would resume.
Particular to the office sector, the pandemic has driven companies to rethink the traditional office space usage and fostered a shift towards more flexible work arrangements. In our view, we see such a trend would add contractionary pressures to office space over the longer-term.
Chart 1: Property and Rental Price Index of Office and Retail Space in the Central Region
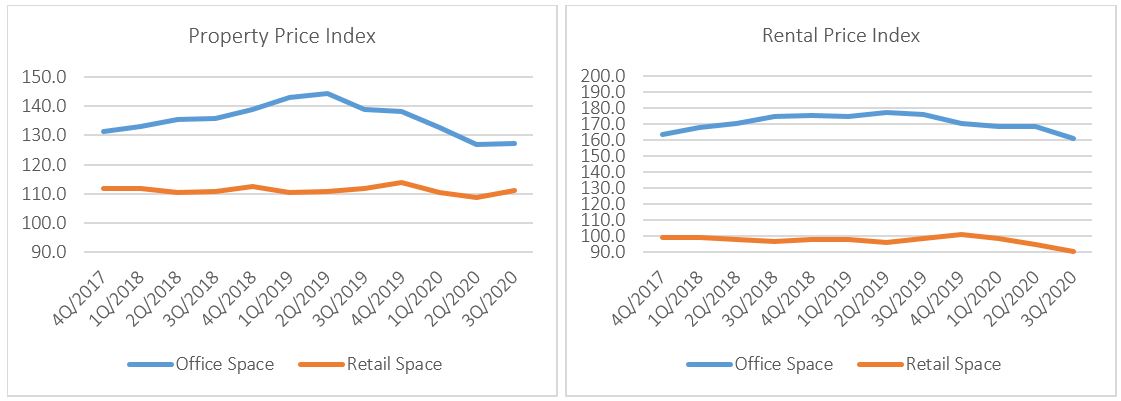 Source: Urban Redevelopment Authority (“URA”); as of 3Q2020. Base index reference at 4Q/1998 = 100
Refer to Table 1 in Appendix for full data
Office & Retail: Latest available figures from the URA showed that property prices of office and retail spaces fell 7.9% and 2.5% respectively in the period of end 4Q2019 to 3Q2020. Meanwhile, rental prices of office space fell 5.2% while rental prices of retail fell more significantly by 10% in the same period.
The downward drift in property and rental prices corresponded in a period that saw vacancy rates in both the office and retail space rise significantly countrywide. As of 3Q2020, the vacancy rate of office space rose to 12.0% from 10.5% as of end 4Q2019. Meanwhile, the vacancy rate of retail space rose to 9.6% from 7.5% in the same period (see Table 2).
Looking into the supply pipeline (see Table 3), the low new supply added in CY2020 for both office space (2,000 sqm gross) and retail space (7,000 sqm gross) should help to hasten recovery early in CY2021, along with the Phase 3 reopening of the domestic economy. However, we see the impending huge new supply coming in this year for retail space (9,600 sqm) and more so for office space (191,000 sqm), may pose a drag on property prices and rental rates (see Table 3).
Chart 2: Hotel Statistics: RevPar and AOR Trend
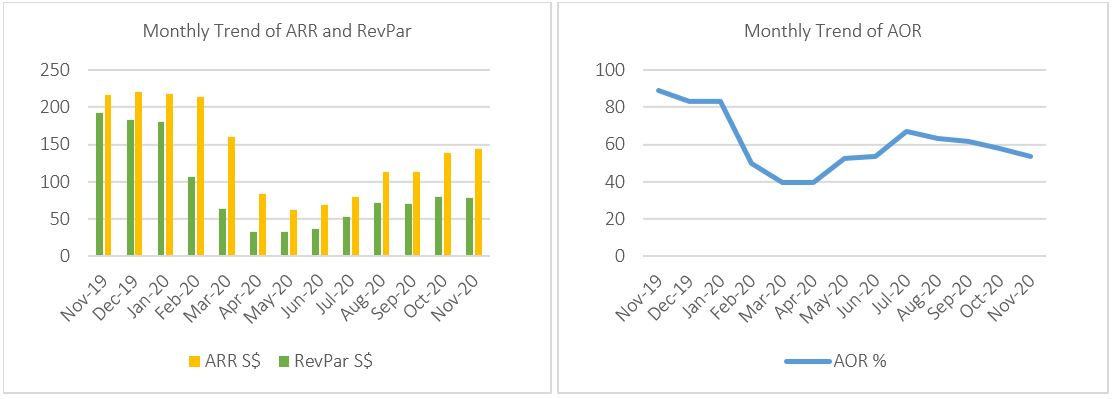 Source: Singapore Tourism Analytics Network by Singapore Tourism Board; as of November 2020
Refer to Table 4 for full data
Hospitality: Over in the hospitality sector, figures from Singapore Tourism Board revealed that Revenue Per Available Room (“RevPar”) to have recovered from the low of $32.3 in May 2020 to $77.8 as of November 2020. Average Occupancy Rate (“AOR”) had also improved dramatically from the lows of 39.6% in March 2020 to 53.8% in November 2020 (see Table 4).
In the short-term, the hospitality REIT sector would benefit from the Singapore Government’s $320 million “Singapore Rediscover” campaign that was launched in December last year. Each Singaporean is entitled to a $100 voucher which can be spent at Singapore attractions or overnight stays in hotels. Overall, we view this stimulus favourably as it would achieve some multiplying effect by inducing locals to channel their unused holiday budgets to support local business.
However, with the campaign ending in June 2021, uncertainties remain to whether if the tourism would restart. Furthermore, the impending new supply to come on stream is also significantly larger this year at 1,691 rooms versus 192 last year. As such, while we see some scope of tactical positioning for recovery plays, we also see some headwinds to return (see Table 5).
Chart 3:&4 Property Price and Rental Index for Industrial Properties
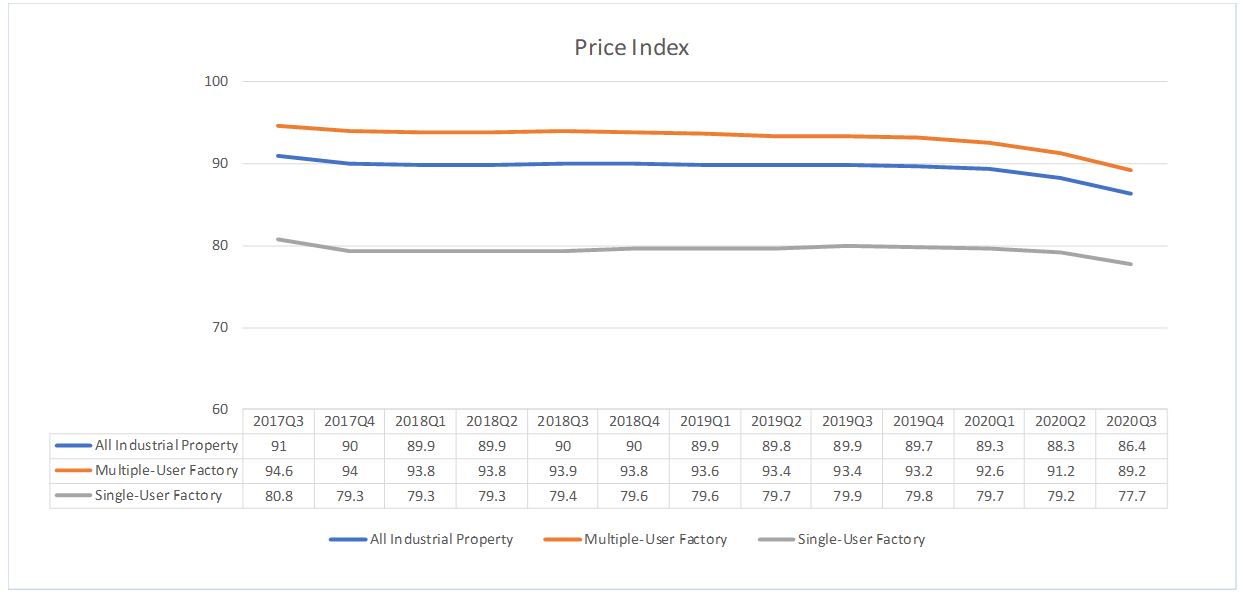
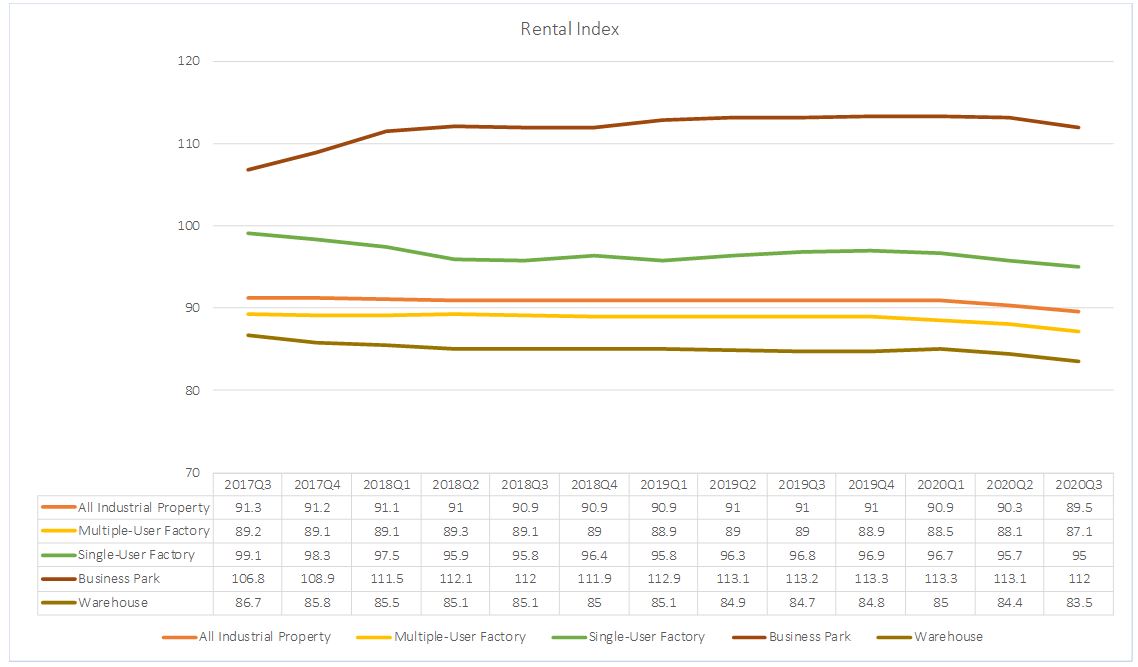 Source: Jurong Town Council (“JTC”); Base index reference 2012Q2 = 100
Refer to JTC for information on indices data coverage and methodology
Industrial Properties: Figures from JTC showed that industrial properties as a whole were more resilient compared to Office, Retail and Hospitality sectors during the peak of the pandemic. The decline in both property prices and rental prices were significantly less pronounced.
As a whole, industrial properties saw prices declined 3.6% for the first 3 quarters of 2020. On the rental aspect, industrial properties saw rental prices fell by 1.64% overall in the same period. Amongst which, the business parks sub-segment saw the lowest decline, with rental rates falling just 1.06%. This is followed by warehouses’ -1.53%, single-user factories’ -1.96% and lastly multiple user factories’ -2.02%. From the data, it can be seen that high-spec business parks and single-user factories (especially for built-to-suit cases) are more resilient to displacement due to limited alternatives.
The industrial property market is the only sector to register a higher occupancy rate for the 3 quarters of 2020. Overall, the sector saw occupancy rate gain 0.4 percentage points from the end 4Q2019 to 89.6% as of 3Q2020. All sub-segments registered gains in occupancy in the period, revealing that demand for industrial space has stayed quite healthy.
Nonetheless, we are cognitive about the impending new supply expected to come on stream for the industrial space as well. In 2021, figures from JTC showed that about 2.2 million sqm of the new industrial stock is expected to be added into the 5.2 million sqm of vacant stock compared to 0.59 million sqm in 2020. Nonetheless, we are not too concerned, given how the sector has been tightening again since 2017 (see Table 6&7).
Updates on Phillip Singapore Real Estate Income Fund
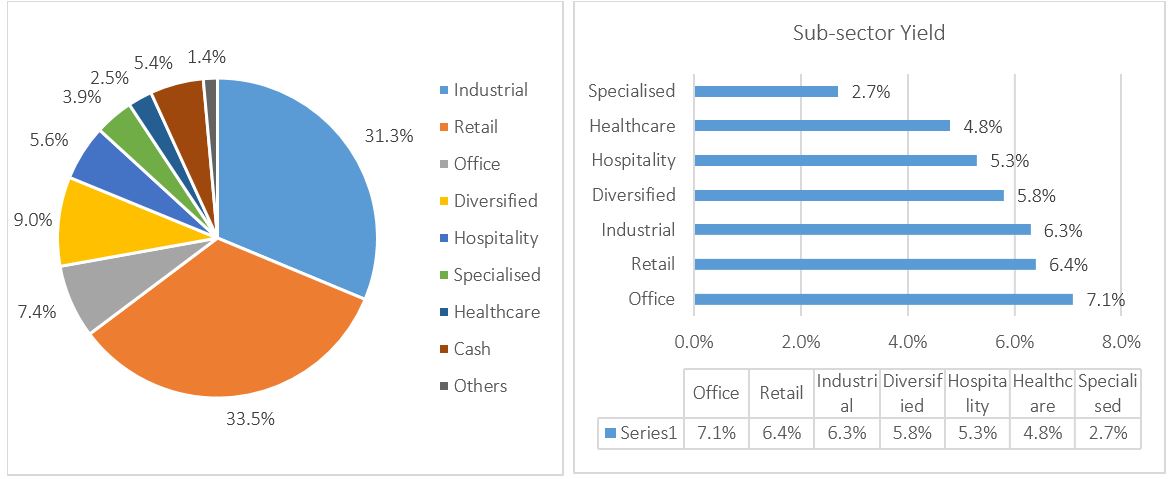
Chart 5: Portfolio Allocation
 Source: Phillip Capital Management; Bloomberg; Singapore Exchange data as of 31 December 2020
As of end CY2020, PSREIF’s allocation is as follows (compared to our last review in 1H2020):
- Industrial – 31.3% (-0.5%)
- Retail – 33.5% (+11.8%)
- Office – 7.4% (-6.8%)
- Diversified – 9.0% (-0.5%)
- Hospitality – 5.6% (+3.2%)
- Specialised – 3.9% (-2.7%)
- Healthcare – 2.5% (0.1%)
PSREIF’s allocation in the industrial (-0.5%), diversified (-0.5%) and healthcare (-0.1%) sectors were largely unchanged while we have reduced our exposure in office (-6.8%) and specialized S-REITs (-2.7%). We have rotated more into retail (+11.8%) and increased our slim exposure to the hospitality (+3.2%) S-REITs for tactical positioning.
Important Information
This material and information herein is provided by Phillip Capital Management (S) Ltd (“PCM”) for general information only and does not constitute a recommendation, an offer to sell, or a solicitation to invest in the fund(s) mentioned herein. It does not have any regard to your specific investment objectives, financial situation and any of your particular needs. The information is subject to change at any time without notice. The value of the units and the income accruing to the units may fall or rise. You should read the relevant prospectus and the accompanying product highlights sheet (“PHS”) for disclosure of key features, key risks and other important information of the relevant fund (s) and obtain advice from a financial adviser (“FA”) before making a commitment to invest in the fund(s). In the event that you choose not to obtain advice from a FA, you should assess whether the fund(s) is/are suitable for you before proceeding to invest. A copy of the prospectus and PHS are available from PCM or any of its authorized distributors. Investments are subject to investment risks including the possible loss of the principal amount invested. Past performance is not necessarily indicative of the future or likely performance of the fund(s). There can be no assurance that investment objectives will be achieved. Any use of financial derivative instruments will be for hedging and/or for efficient portfolio management. Investments in the fund(s) managed by PCM are not obligations of, deposits in, or guaranteed by PCM or any of its affiliates. PhillipCapital Group of Companies, including PCM, their affiliates and/or their officers, directors and/or employees may own or have positions in the investments mentioned herein or related thereto. This publication and Information herein are not for any person in any jurisdiction or country where such distribution or availability for use would contravene any applicable law or regulation or would subject PCM to any registration or licensing requirement in such jurisdiction or country. The fund(s) is/are not offered to U.S. Persons. The regular dividend distributions, where applicable, are paid either out of income and/or capital, not guaranteed and are subject to PCM’s discretion. Such dividend distributions will reduce the available capital for reinvestment and may result in an immediate decrease in the net asset value of the fund(s). Past payout yields (rates) and payments do not represent future payout yields (rates) and payments. Please refer to for more information in relation to the dividend distributions. The information provided herein is based on certain information, conditions and/or assumptions available as at the date of this publication that may be obtained, provided or compiled from public and/or third party sources which PCM has no reason to believe are unreliable; and may contain optimistic statements/opinions/views regarding future events or future financial performance of countries, markets or companies. Any opinion or view herein is an expression of belief of the individual author or the indicated source (as applicable) only. PCM makes no representation or warranty that such information is accurate, complete, verified or should be relied upon as such. You must make your own financial assessment of the relevance, accuracy and adequacy of the information in this material. Accordingly, no warranty whatsoever is given and no liability whatsoever is accepted for any loss or consequences arising whether directly or indirectly as a result of your acting based on the information in this material. The information does not constitute, and should not be used as a substitute for, tax, legal or investment advice. The information should not be relied upon exclusively or as authoritative without further being subject to your own independent verification and exercise of judgement. This material has not been reviewed by The Monetary Authority of Singapore.