
Weekly Commentary: 03 January 2022 – 09 January 2022
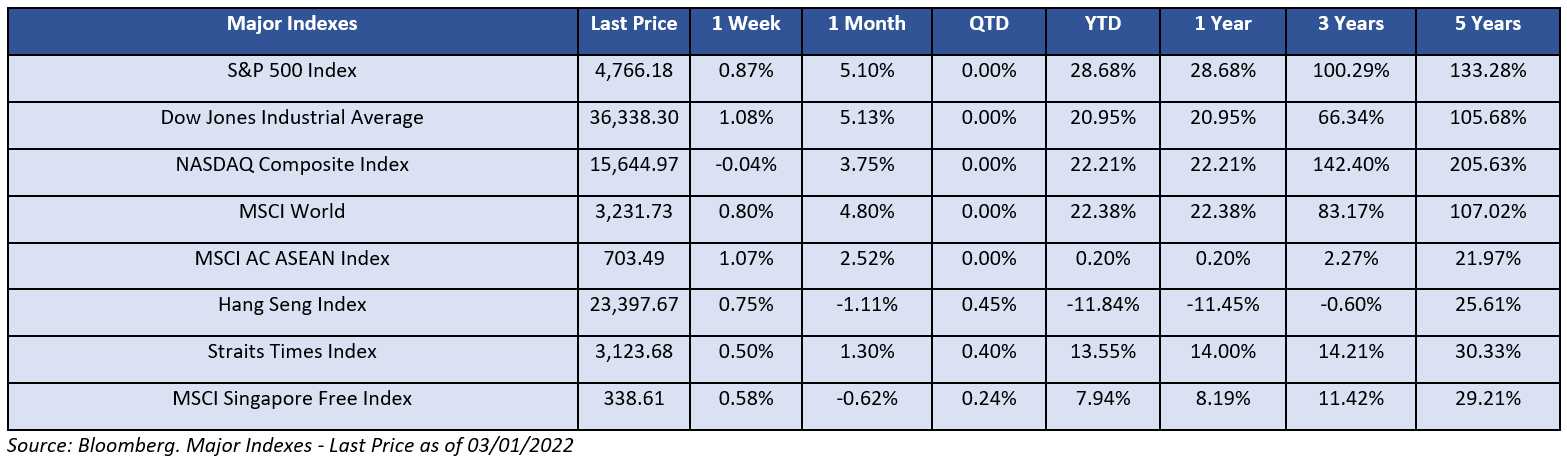
Mostly positive returns all of the major indices last week. Growth lagged value as the NASDAQ Composite slightly slipped by 0.04% while the S&P 500 and the DJIA gained 0.87% and 1.08% each. Mixed weekly return for the S&P 500 sectors with the top three performers being Utilities (+2.15%%), Real Estate (+1.73%), and Financials (+1.46%), while Communication Services (-1.68%), InfoTech (-1.67%), and Energy (-1.13%) formed the bottom three sectors. For the year of 2021, the S&P 500 delivered the best return at 28.68%, followed by the NASDAQ Composite’s 22.21% and DJIA’s 20.95% respectively. Energy (+54.39% YoY) and cyclical sectors such as Real Estate (+46.14% YoY) and Financials (+34.87% YoY), outperformed in the year highlighted by the energy crunch, high inflation, and rising interest rate. In the other hand, defensive sectors such as Utilities (+17.67% YoY) and Consumer Staples (+18.63% YoY) lagged the rest. The Hang Seng’s 0.75% edged out the STI’s 0.5% last week. However, the STI (+14% YoY) outperformed Hang Seng (-11.45% YoY) by the end of 2021.
Moving forward in the new year, high inflation and rising interest rate will remain as a concern for the market due to rising energy prices and supply chain disruptions. The rising number of infections globally due to the Omicron variant will further slowed the recovery pace as well. The Consumer Price Index published monthly by the U.S. Bureau of Labor Statistics (BLS) indicated that the inflation rate by the end of November has increased by 0.6% to reach 6.8%, the highest since 1982. Many are fearing that this will force the Fed’s hands in raising benchmark interest rate at a faster pace as high inflation usually demands an increase in interest rates and this is not good news for stocks that had been valued very generously. The yield-curve flattened last week as both the U.S. 2-year and 10-year Treasury yield increased by 4 bp and 2 bp to reach 0.73% and 1.51% respectively. The 10Y-2Y US Treasury yield spread contracted slightly to 0.78%. Stock market sentiment was strengthening as the global HY-IG spread widened by 4 bp to 1.91% while the CBOE Volatility Index (VIX) decreased by 74 bp to 17.22%. Both are still lying well below their 50-day exponential moving average of 2.03% and 19.78%.
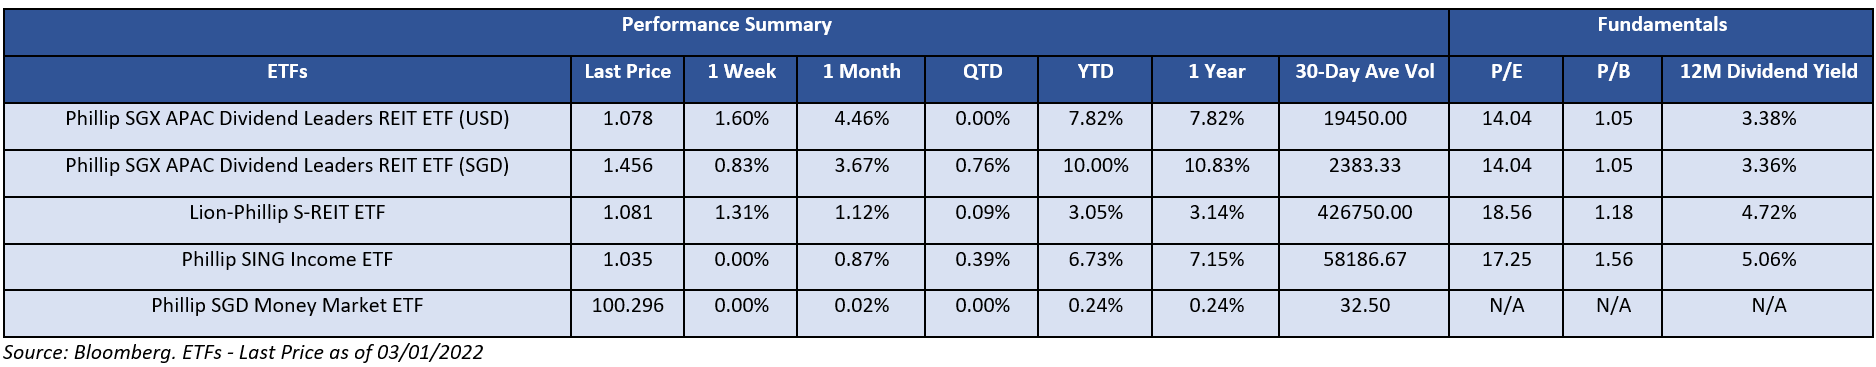
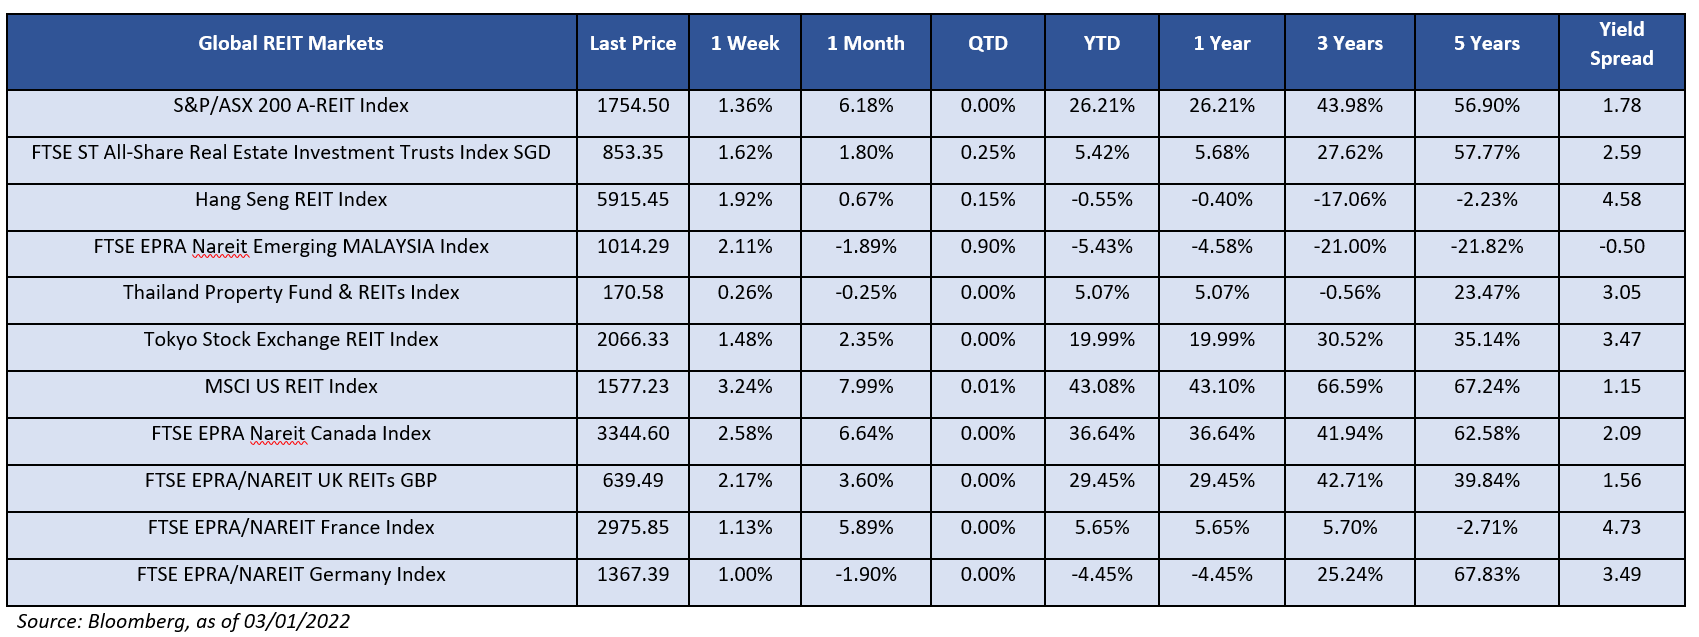
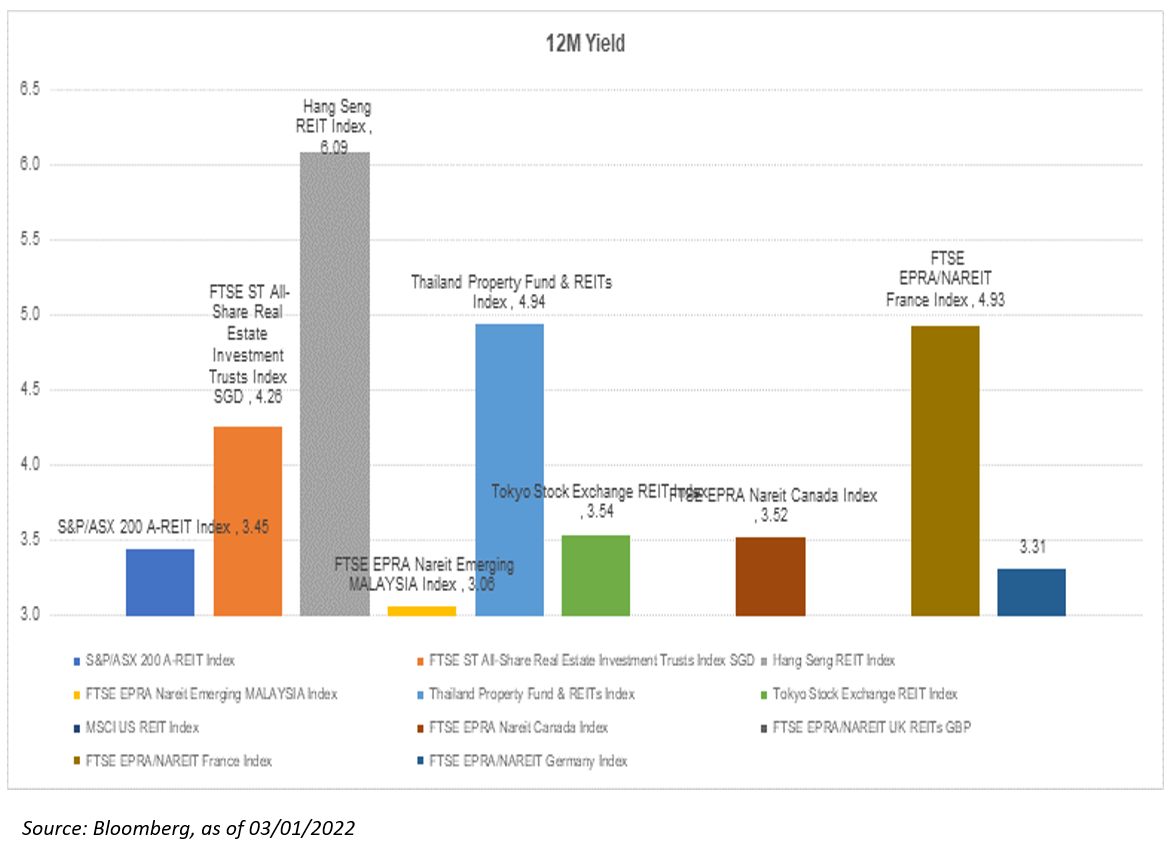
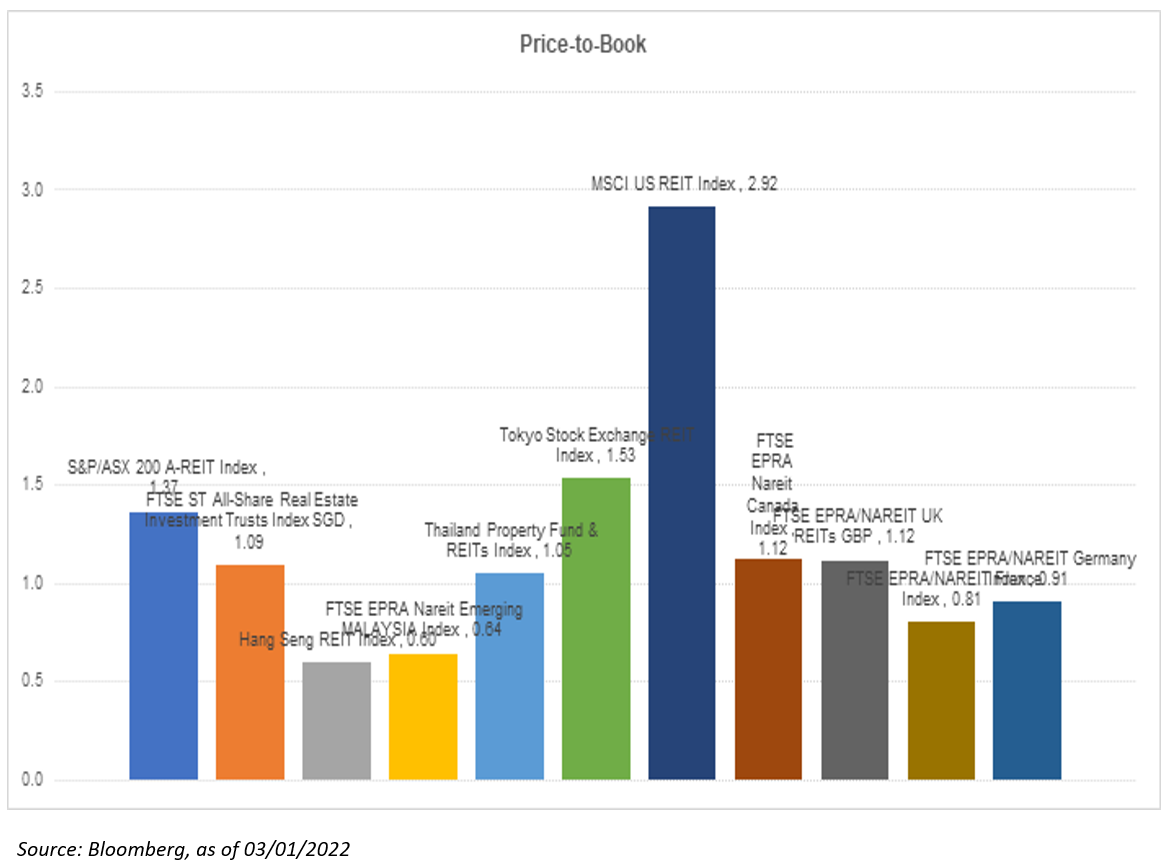
As can be seen below, the global REIT markets reported positive returns all around. The overall 12-month yield spreads remained positive and still favorable towards REIT’s forward total return. Back at home, the iEdge S-REIT Index gained 1.59% with two sectors that performed the best being Hospitality (+2.63%) and Healthcare (+2.45%). The lagging sectors in the other hand, were Retail (+1.60%) and Industrial (+1.65%). In 2021, the best performing S-REIT sectors were Healthcare (+40.69% YoY) and Diversified (+17.33% YoY) while the bottom two sectors were Hospitality (-0.07% YoY) and Retail (+4.13% YoY). Currently, Office and Diversified offered the best room for growth. Both have the best average yield of 5.5% to 5.8% respectively among all the other S-REIT sectors while being quite fairly valued in terms of Price-to-Book or Price-to-NAV.
Back at home, we saw an uptrend in infections as the 7-day moving average of total COVID-19 cases rose to 329 from 275 the previous week. The Omicron variant had brought in a new wave of the pandemic and saw many countries tightening their restrictions to curb the spread. So far, more than 50 countries have stepped up border controls to slow the spread and Singapore had also stopped all new vaccinated travel lanes (VTLs) destinations and relaxation on social measures. The VTLs launch with Qatar, Saudi Arabia and the United Arab Emirates are currently deferred until further notice. Virus development will need to be closely observed in order to identify the right time for a recovery play as the new variant will likely delay the pace moving forward.
Important Information
This material is provided by Phillip Capital Management (S) Ltd (“PCM”) for general information only and does not constitute a recommendation, an offer to sell, or a solicitation of any offer to invest in any of the exchange-traded fund (“ETF”) or the unit trust (“Products”) mentioned herein. It does not have any regard to your specific investment objectives, financial situation and any of your particular needs. You should read the Prospectus and the accompanying Product Highlights Sheet (“PHS”) for key features, key risks and other important information of the Products and obtain advice from a financial adviser (“FA“) before making a commitment to invest in the Products. In the event that you choose not to obtain advice from a FA, you should assess whether the Products are suitable for you before proceeding to invest. A copy of the Prospectus and PHS are available from PCM, any of its Participating Dealers (“PDs“) for the ETF, or any of its authorised distributors for the unit trust managed by PCM.
An ETF is not like a typical unit trust as the units of the ETF (the “Units“) are to be listed and traded like any share on the Singapore Exchange Securities Trading Limited (“SGX-ST”). Listing on the SGX-ST does not guarantee a liquid market for the Units which may be traded at prices above or below its NAV or may be suspended or delisted. Investors may buy or sell the Units on SGX-ST when it is listed. Investors cannot create or redeem Units directly with PCM and have no rights to request PCM to redeem or purchase their Units. Creation and redemption of Units are through PDs if investors are clients of the PDs, who have no obligation to agree to create or redeem Units on behalf of any investor and may impose terms and conditions in connection with such creation or redemption orders. Please refer to the Prospectus of the ETF for more details.
Investments are subject to investment risks including the possible loss of the principal amount invested, and are not obligations of, deposits in, guaranteed or insured by PCM or any of its subsidiaries, associates, affiliates or PDs. The value of the units and the income accruing to the units may fall or rise. Past performance is not necessarily indicative of the future or likely performance of the Products. There can be no assurance that investment objectives will be achieved. Any use of financial derivative instruments will be for hedging and/or for efficient portfolio management. PCM reserves the discretion to determine if currency exposure should be hedged actively, passively or not at all, in the best interest of the Products. The regular dividend distributions, out of either income and/or capital, are not guaranteed and subject to PCM’s discretion. Past payout yields and payments do not represent future payout yields and payments. Such dividend distributions will reduce the available capital for reinvestment and may result in an immediate decrease in the net asset value (“NAV”) of the Products. Please refer to <www.phillipfunds.com> for more information in relation to the dividend distributions.
The information provided herein may be obtained or compiled from public and/or third party sources that PCM has no reason to believe are unreliable. Any opinion or view herein is an expression of belief of the individual author or the indicated source (as applicable) only. PCM makes no representation or warranty that such information is accurate, complete, verified or should be relied upon as such. The information does not constitute, and should not be used as a substitute for tax, legal or investment advice.
The information herein are not for any person in any jurisdiction or country where such distribution or availability for use would contravene any applicable law or regulation or would subject PCM to any registration or licensing requirement in such jurisdiction or country. The Products is not offered to U.S. Persons. PhillipCapital Group of Companies, including PCM, their affiliates and/or their officers, directors and/or employees may own or have positions in the Products. This advertisement has not been reviewed by the Monetary Authority of Singapore.