
Weekly Commentary: 28 February 2022 – 06 March 2022
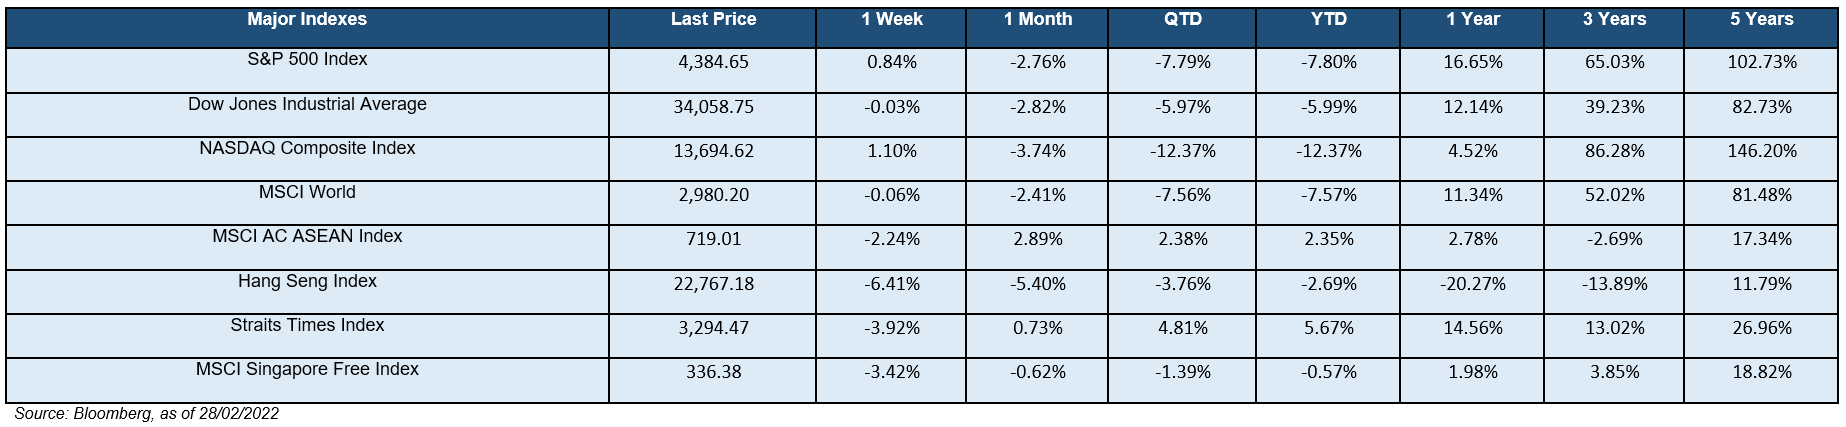
 The stock market did not fall into a deeper slump last week despite the escalation in the Russia-Ukraine conflict. This is mostly due to the overall response or sanctions from the U.S and other NATO allied countries that were weaker than expected. Value stocks as loosely represented by the DJIA (-0.03%) slipped slightly while the NASDAQ Composite (+1.10%) and the S&P 500 (+0.84%) regained some of their previous losses. Both the STI (-3.92%) and Hang Seng (-6.41%) had quite a significant slippage last week in comparison. We saw overall positive returns from all of the S&P 500 sectors as well, with the exception of the bottom three sectors – Consumer Discretionary (-2.13%), Consumer Staples (-0.30%), and Financials (-0.25%). In the other hand, Real Estate (+2.74%) and Healthcare (+2.74%) had regained their momentum, while defensives such as Utilities (+2.17) has also performed well.
The Consumer Price Index published monthly by the U.S. Bureau of Labor Statistics (BLS) had indicated that the U.S. inflation rate by the end of January had increased by 0.5% MoM to reach 7.5%. The average US inflation rate for 2021 was as 4.7%, the highest since 1990. Inflation is currently at the highest we have seen since 1982 and will likely remain in the high range in the near term due to the lingering global energy crunch and supply chain disruptions caused by the pandemic. The high inflation has been the main driver for an increase in interest rate, which has been suppressed to stimulate economic growth during the pandemic for the past two years. Investors have been pricing in the upcoming rate-hikes and the aftermath from the Russia-Ukraine conflict, resulting in a punishing correction and high volatility in the stock market for the past few weeks.
The yield-curve flattened last week as the 10Y-2Y US Treasury yield spread fell by 5 bp to 0.42%. The U.S. 2-year increased by 2 bp to 1.49% while the 10-year decreased by 2 bp to reach 1.90%. Stock market sentiment remained weak and volatile as the global HY-IG spread largely unchanged as it slightly widened by 1 bp to 2.48% while the CBOE Volatility Index (VIX) decreased by 52 bp to 27.59%. Both are well over to their 50-day exponential moving average of 2.23% and 24.17%.
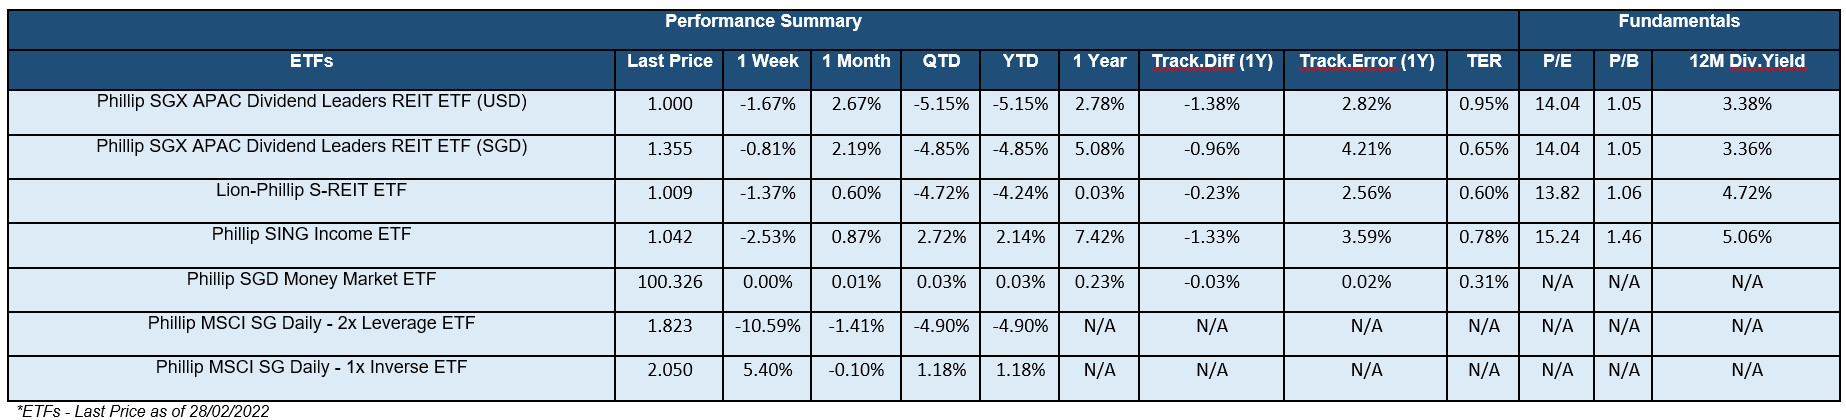
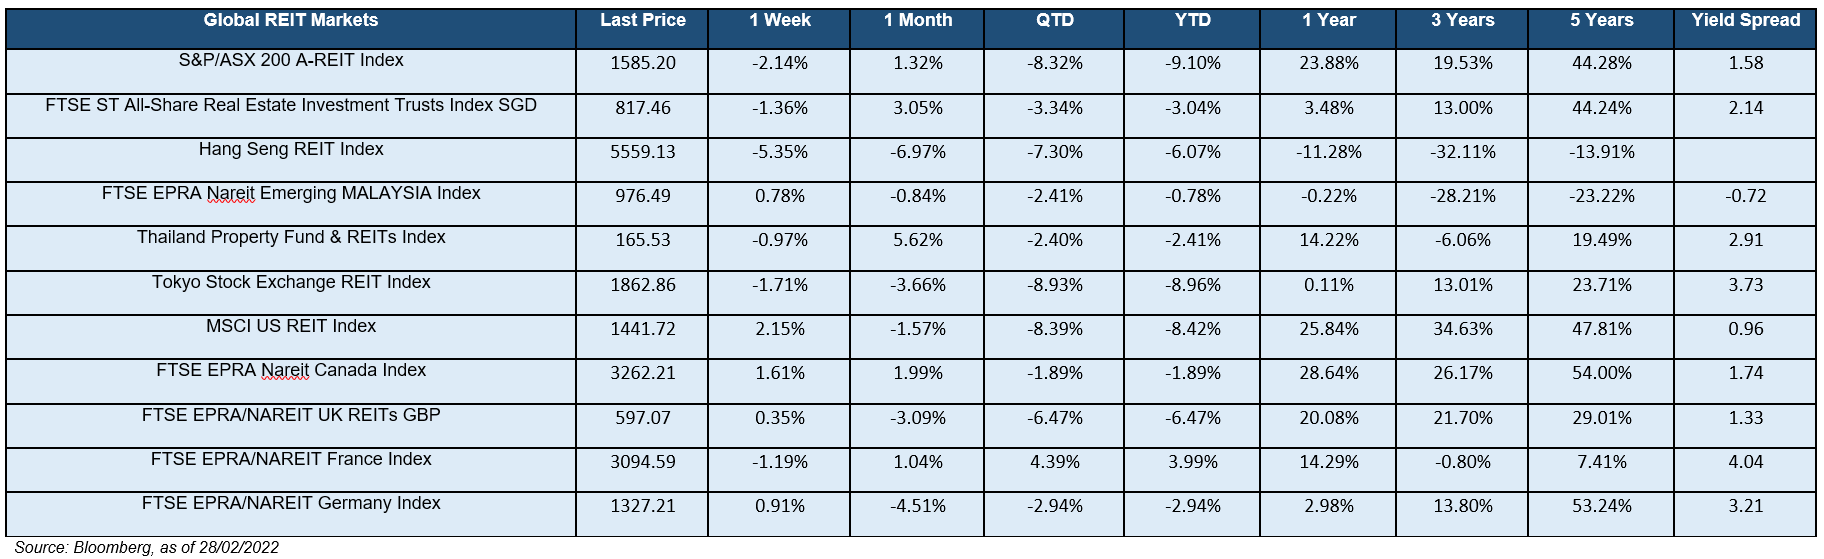
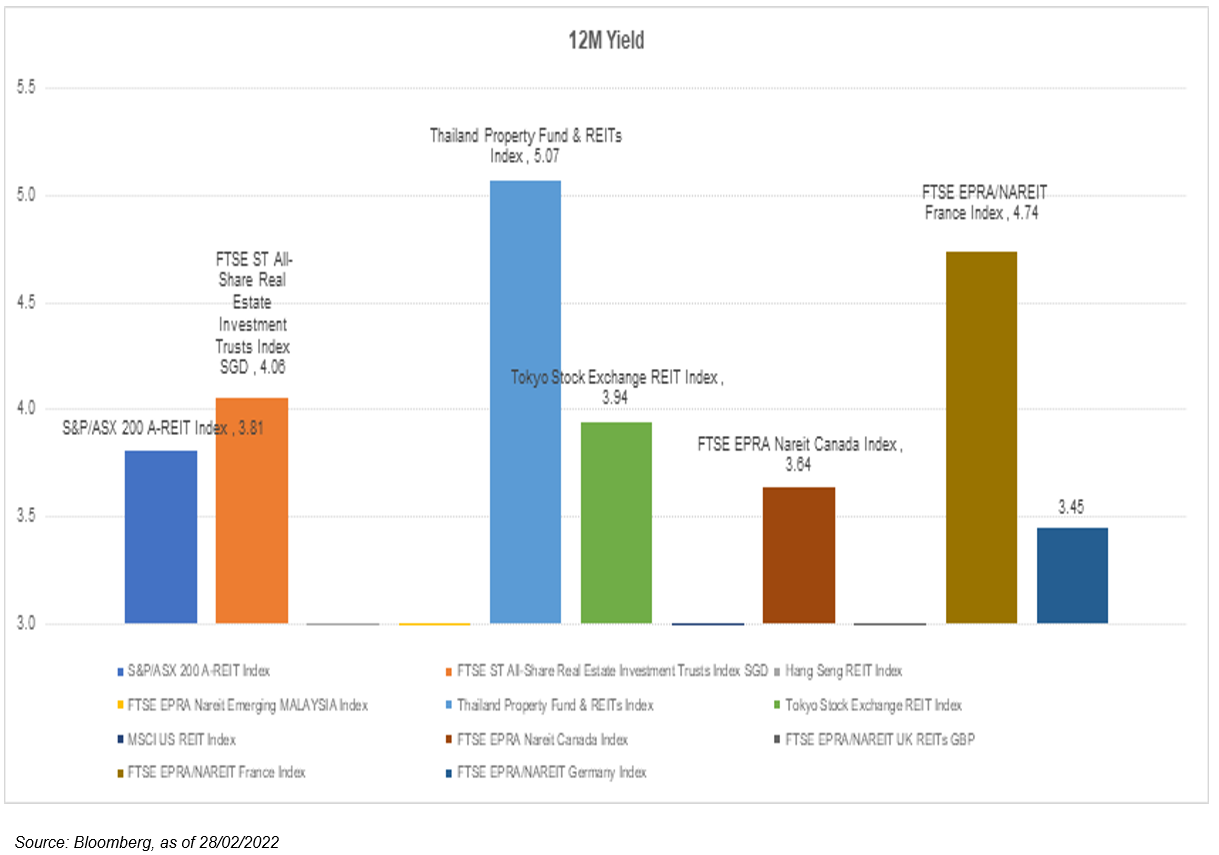
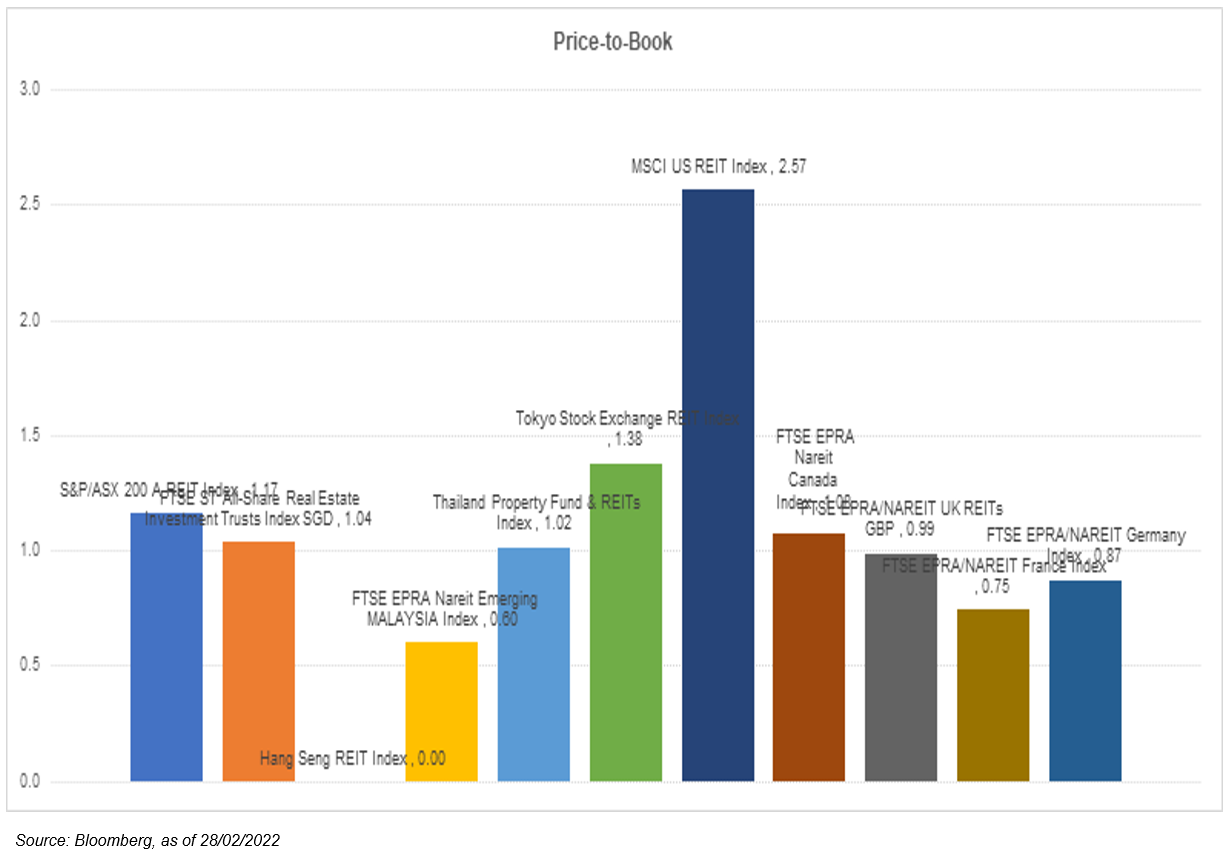
 As can be seen below, weekly performance from the global REIT markets were mixed although the overall 12-month yield spreads remained positive and still favorable towards REIT’s forward total return. The iEdge S-REIT Index (-2.23%) and all of the S-REIT sectors reported negative returns. The two S-REIT sectors that held up the best were Healthcare (-1.55%) and Industrial (-1.95%). The worst hit sectors in the other hand, were Hospitality (-3.81%) and Office (-2.31%). The slippage can be attributed to the surge in cases that resulted in a push back of the new streamlined measures from the Singapore Government to an undisclosed date. Back at home, we still saw an increase in infections as the 7-day moving average of total COVID-19 cases sharply rose to around 18.3 thousands from 14.6 thousands the previous week. As of now, there is no change in the COVID policy stance from the Singapore government that is in favour of reopening. New VTL with Hong Kong, as well as previously deferred VTLs with Qatar, Saudi Arabia and the United Arab Emirates (UAE), will soon be launched. VTL quotas will also be progressively restored and increased. Further development will need to be closely observed in order to identify the right time for a recovery play as Omicron will likely delay the pace moving forward and the supporting indicators are currently still weak. For example, 57 thousands inbound arrivals to the country in January is still significantly below pre-COVID range of 1.5-1.8 million visitors per month.
Important Information
This material is provided by Phillip Capital Management (S) Ltd (“PCM”) for general information only and does not constitute a recommendation, an offer to sell, or a solicitation of any offer to invest in any of the exchange-traded fund (“ETF”) or the unit trust (“Products”) mentioned herein. It does not have any regard to your specific investment objectives, financial situation and any of your particular needs. You should read the Prospectus and the accompanying Product Highlights Sheet (“PHS”) for key features, key risks and other important information of the Products and obtain advice from a financial adviser (“FA“) before making a commitment to invest in the Products. In the event that you choose not to obtain advice from a FA, you should assess whether the Products are suitable for you before proceeding to invest. A copy of the Prospectus and PHS are available from PCM, any of its Participating Dealers (“PDs“) for the ETF, or any of its authorised distributors for the unit trust managed by PCM.
An ETF is not like a typical unit trust as the units of the ETF (the “Units“) are to be listed and traded like any share on the Singapore Exchange Securities Trading Limited (“SGX-ST”). Listing on the SGX-ST does not guarantee a liquid market for the Units which may be traded at prices above or below its NAV or may be suspended or delisted. Investors may buy or sell the Units on SGX-ST when it is listed. Investors cannot create or redeem Units directly with PCM and have no rights to request PCM to redeem or purchase their Units. Creation and redemption of Units are through PDs if investors are clients of the PDs, who have no obligation to agree to create or redeem Units on behalf of any investor and may impose terms and conditions in connection with such creation or redemption orders. Please refer to the Prospectus of the ETF for more details.
Investments are subject to investment risks including the possible loss of the principal amount invested, and are not obligations of, deposits in, guaranteed or insured by PCM or any of its subsidiaries, associates, affiliates or PDs. The value of the units and the income accruing to the units may fall or rise. Past performance is not necessarily indicative of the future or likely performance of the Products. There can be no assurance that investment objectives will be achieved. Any use of financial derivative instruments will be for hedging and/or for efficient portfolio management. PCM reserves the discretion to determine if currency exposure should be hedged actively, passively or not at all, in the best interest of the Products. The regular dividend distributions, out of either income and/or capital, are not guaranteed and subject to PCM’s discretion. Past payout yields and payments do not represent future payout yields and payments. Such dividend distributions will reduce the available capital for reinvestment and may result in an immediate decrease in the net asset value (“NAV”) of the Products. Please refer to <www.phillipfunds.com> for more information in relation to the dividend distributions.
The information provided herein may be obtained or compiled from public and/or third party sources that PCM has no reason to believe are unreliable. Any opinion or view herein is an expression of belief of the individual author or the indicated source (as applicable) only. PCM makes no representation or warranty that such information is accurate, complete, verified or should be relied upon as such. The information does not constitute, and should not be used as a substitute for tax, legal or investment advice.
The information herein are not for any person in any jurisdiction or country where such distribution or availability for use would contravene any applicable law or regulation or would subject PCM to any registration or licensing requirement in such jurisdiction or country. The Products is not offered to U.S. Persons. PhillipCapital Group of Companies, including PCM, their affiliates and/or their officers, directors and/or employees may own or have positions in the Products. This advertisement has not been reviewed by the Monetary Authority of Singapore.