
Weekly Commentary: 18 April 2022 – 24 April 2022
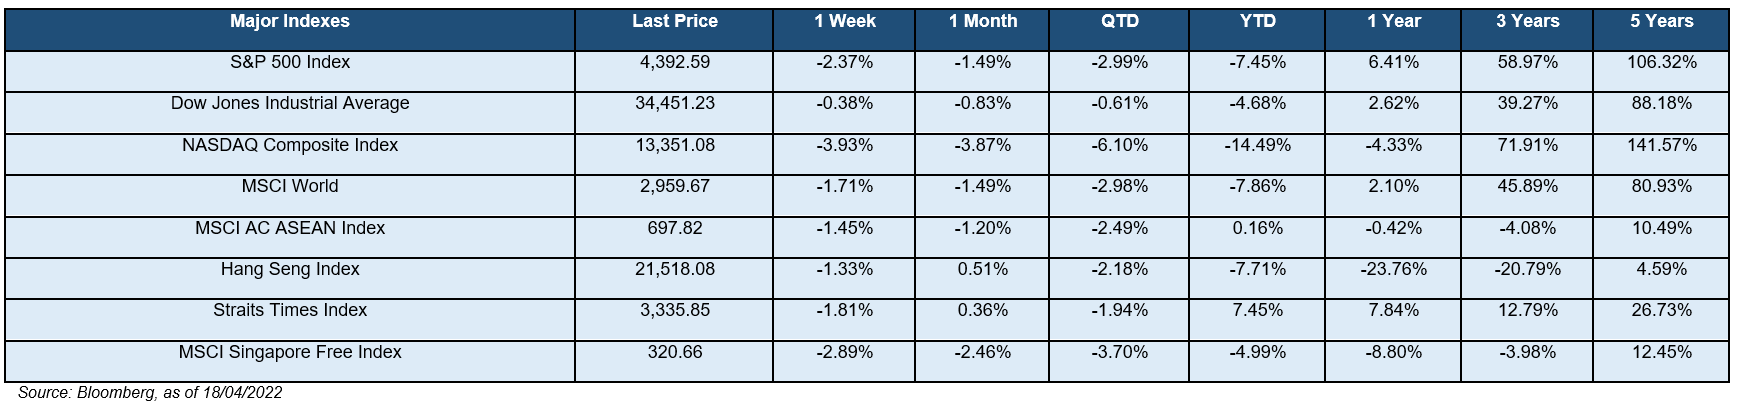
 Negative returns reported by all of the major indices for two consecutive weeks. Growth stocks as loosely represented by the NASDAQ Composite (-3.93%) fared worst again, followed by the S&P 500 (-2.37%) and the DJIA (-0.38%). Closer to home, both the STI (-1.81%) and the Hang Seng (-1.33%) were also in the negative territory. In terms of the S&P 500 sectors, still mixed returns overall, with Energy (+3.57%), Materials (+1.17%), and the Consumer Discretionary (+1.10%) delivering the best performance. In the other hand, cyclicals such as Financials (-2.16%), Communication Services (-1.28%), and InfoTech (-1.24%) continued to relatively underperformed for three straight weeks as there were growing fears in the stock market that the U.S. economy is heading towards a recession and a more hawkish May rate hike is possible judging from the most recent statement by the Federal Reserve. Meanwhile, fighting continues in Mariupol in the Ukraine-Russia conflict.
The Consumer Price Index published monthly by the U.S. Bureau of Labor Statistics (BLS) had indicated that the U.S. inflation rate by the end of March had increased by 1.2% MoM to reach 8.5%. This is more than four times above the Fed’s 2% target and the highest we have seen since 1982’s 8.4%. The rate is expected to climb due to the high energy prices. Strong consumer demand, shortages of supplies such as semiconductors, and supply-chain constraints caused by the sporadic pandemic outbreaks had also elevated inflation for the past year. The high inflation has been the main driver for an increase in interest rate, which was suppressed to stimulate economic growth during the pandemic. Last month, the U.S. Federal Reserve raised its benchmark interest rate by 0.25 percentage points, ending the near-zero rates of the pandemic era and starting a hiking cycle set to last well into 2023. The size and scope of future hikes remain unclear however. The possible hawkish stance from the Fed in the next rate hike means slower economic growth and present the possibility of a recession if the rate is increased too far.
The yield-curve continued to steepen as the 10Y-2Y US Treasury yield increased to 0.37%. The U.S. 2-year Treasury yields had decreased by 8 bp to reach 2.45% while the 10-year increased by 12 bp to 2.83%%. The overall stock market sentiment remained in risk-off mode and saw an uptick in volatility as the global High Yield (HY) – Investment Grade (IG) spread widened by 4 bp to 2.26% while the CBOE Volatility Index (VIX) increased by 154 bp to 22.7%.
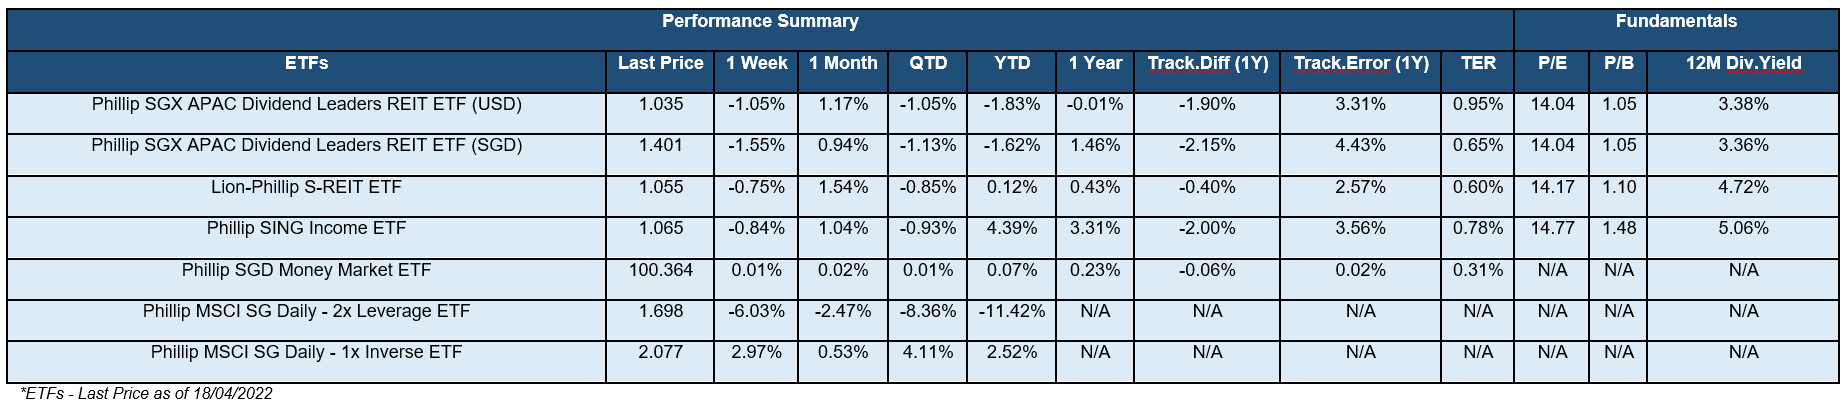
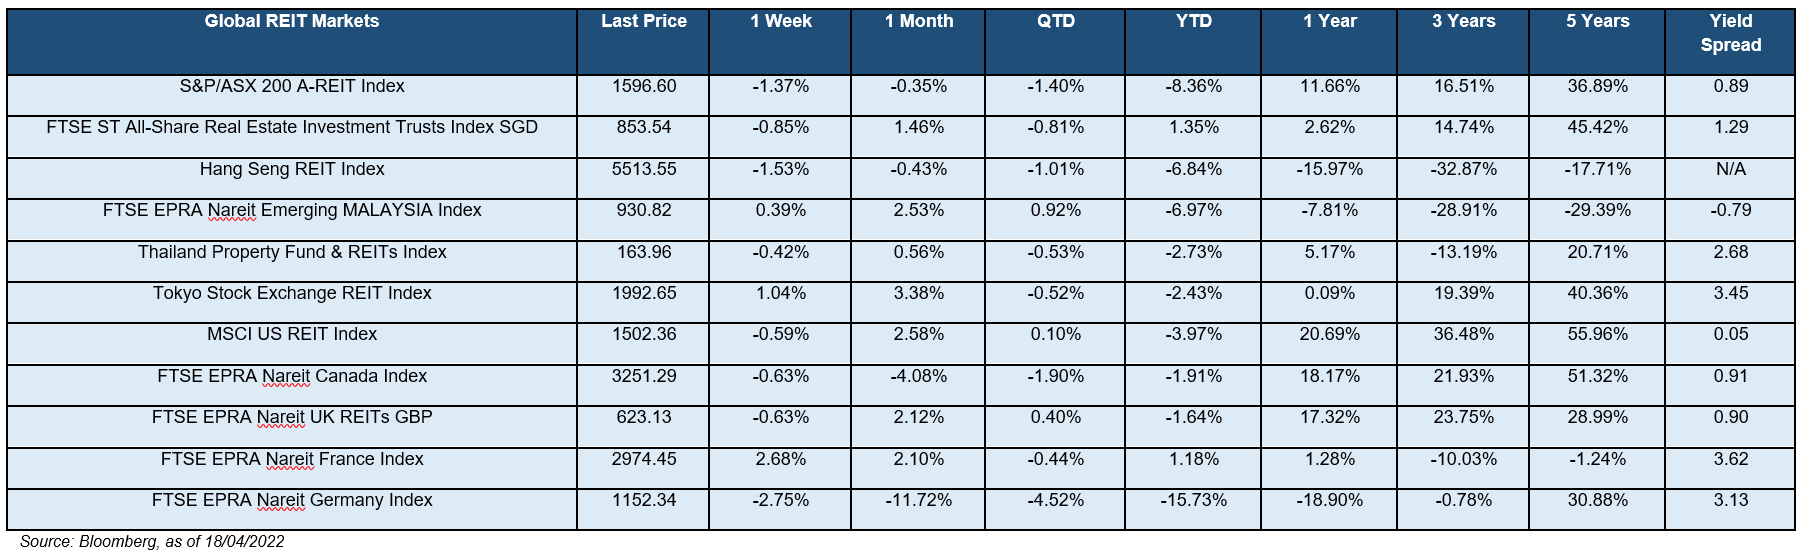
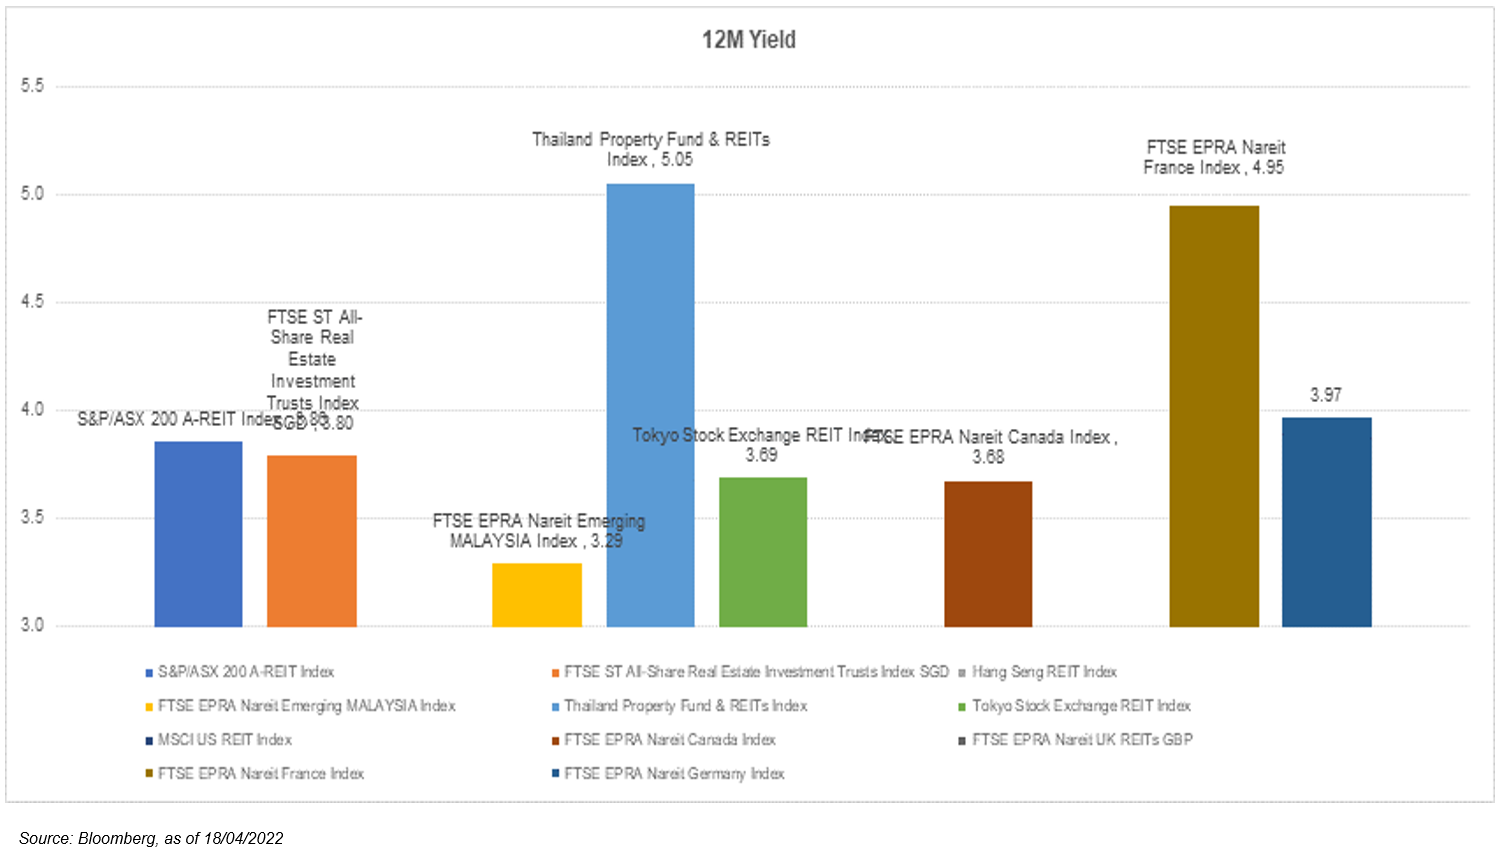
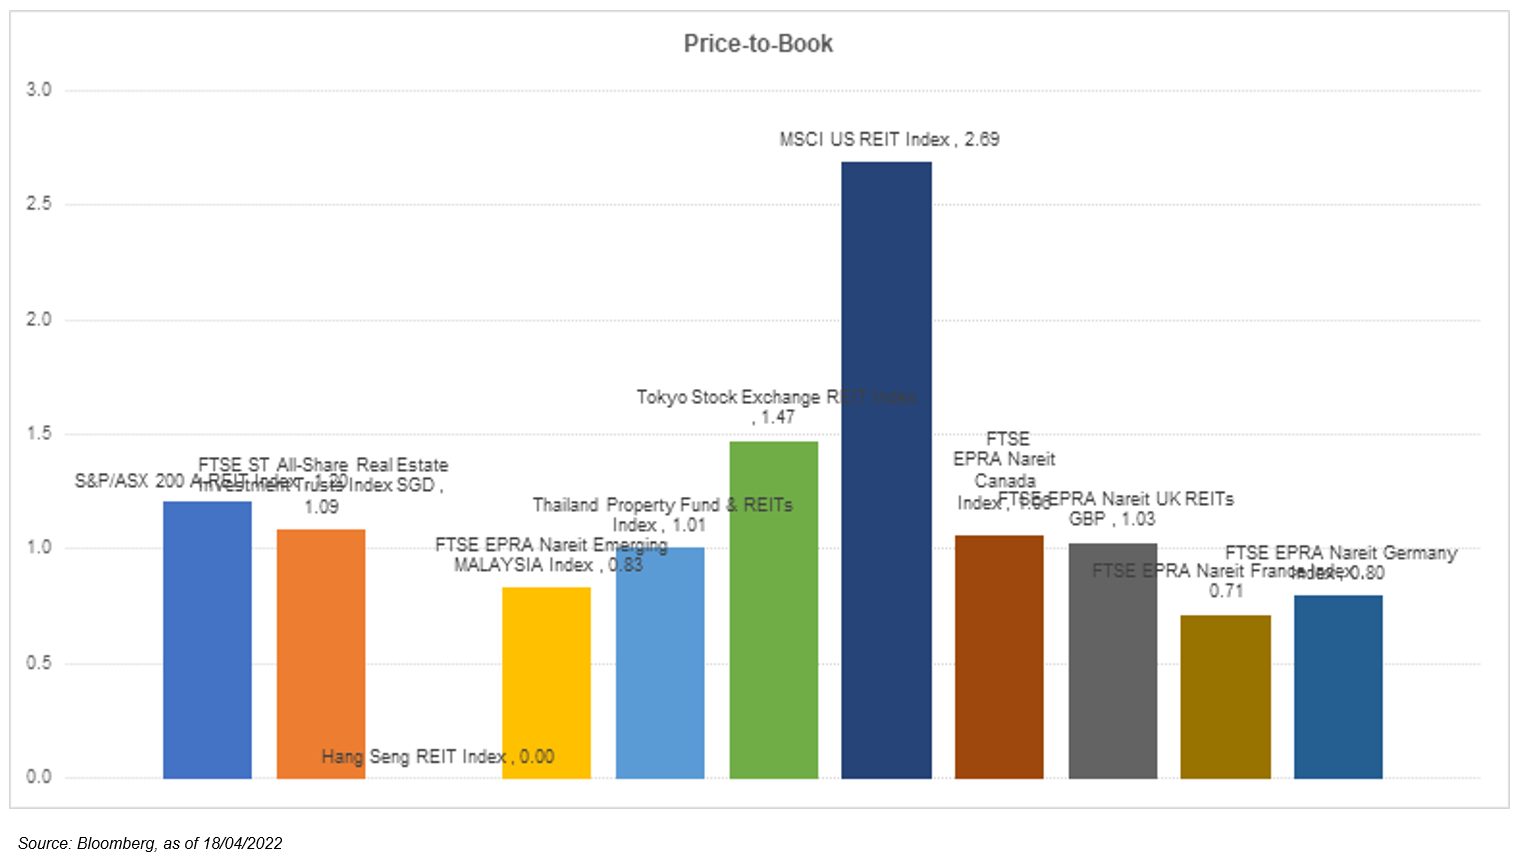
 As can be seen below, weekly performance from the global REIT markets were mostly negative with the exception of the Japan, Malaysia, and France markets. However, the overall 12-month yield spreads are also mostly positive and favorable towards REIT’s forward total return. Back at home, the iEdge S-REIT Index (-0.01%) and all of the S-REIT sectors mostly saw muted returns. The two S-REIT sectors that fared the best were Hospitality (+2.68%) and Healthcare (+1.09%). The worst-hit sectors in the other hand, were Diversified (-0.21%) and Industrial (-0.14%). With regards to the pandemic, the 7-day moving average of total COVID-19 cases continued to fall to around 3.3 thousand cases, from 4.4 thousand the previous week. Hospitality continued to outperform as Singapore progressed steadily to a full reopening. The new changes in COVID-10 rules in Singapore that eased off most of the current restrictions and allowed all fully vaccinated travellers to enter Singapore unrestricted is expected to bring more inbound visitors to Singapore. Overall, these are positive developments towards a full reopening and good news for the sectors badly affected by the delayed recovery, but the situation is to be observed closely still as a lot can go wrong quickly with high transmissibility of the virus.
Important Information
This material is provided by Phillip Capital Management (S) Ltd (“PCM”) for general information only and does not constitute a recommendation, an offer to sell, or a solicitation of any offer to invest in any of the exchange-traded fund (“ETF”) or the unit trust (“Products”) mentioned herein. It does not have any regard to your specific investment objectives, financial situation and any of your particular needs. You should read the Prospectus and the accompanying Product Highlights Sheet (“PHS”) for key features, key risks and other important information of the Products and obtain advice from a financial adviser (“FA“) before making a commitment to invest in the Products. In the event that you choose not to obtain advice from a FA, you should assess whether the Products are suitable for you before proceeding to invest. A copy of the Prospectus and PHS are available from PCM, any of its Participating Dealers (“PDs“) for the ETF, or any of its authorised distributors for the unit trust managed by PCM.
An ETF is not like a typical unit trust as the units of the ETF (the “Units“) are to be listed and traded like any share on the Singapore Exchange Securities Trading Limited (“SGX-ST”). Listing on the SGX-ST does not guarantee a liquid market for the Units which may be traded at prices above or below its NAV or may be suspended or delisted. Investors may buy or sell the Units on SGX-ST when it is listed. Investors cannot create or redeem Units directly with PCM and have no rights to request PCM to redeem or purchase their Units. Creation and redemption of Units are through PDs if investors are clients of the PDs, who have no obligation to agree to create or redeem Units on behalf of any investor and may impose terms and conditions in connection with such creation or redemption orders. Please refer to the Prospectus of the ETF for more details.
Investments are subject to investment risks including the possible loss of the principal amount invested, and are not obligations of, deposits in, guaranteed or insured by PCM or any of its subsidiaries, associates, affiliates or PDs. The value of the units and the income accruing to the units may fall or rise. Past performance is not necessarily indicative of the future or likely performance of the Products. There can be no assurance that investment objectives will be achieved. Any use of financial derivative instruments will be for hedging and/or for efficient portfolio management. PCM reserves the discretion to determine if currency exposure should be hedged actively, passively or not at all, in the best interest of the Products. The regular dividend distributions, out of either income and/or capital, are not guaranteed and subject to PCM’s discretion. Past payout yields and payments do not represent future payout yields and payments. Such dividend distributions will reduce the available capital for reinvestment and may result in an immediate decrease in the net asset value (“NAV”) of the Products. Please refer to <www.phillipfunds.com> for more information in relation to the dividend distributions.
The information provided herein may be obtained or compiled from public and/or third party sources that PCM has no reason to believe are unreliable. Any opinion or view herein is an expression of belief of the individual author or the indicated source (as applicable) only. PCM makes no representation or warranty that such information is accurate, complete, verified or should be relied upon as such. The information does not constitute, and should not be used as a substitute for tax, legal or investment advice.
The information herein are not for any person in any jurisdiction or country where such distribution or availability for use would contravene any applicable law or regulation or would subject PCM to any registration or licensing requirement in such jurisdiction or country. The Products is not offered to U.S. Persons. PhillipCapital Group of Companies, including PCM, their affiliates and/or their officers, directors and/or employees may own or have positions in the Products. This advertisement has not been reviewed by the Monetary Authority of Singapore.