
Weekly Commentary: 09 May 2022 – 15 May 2022
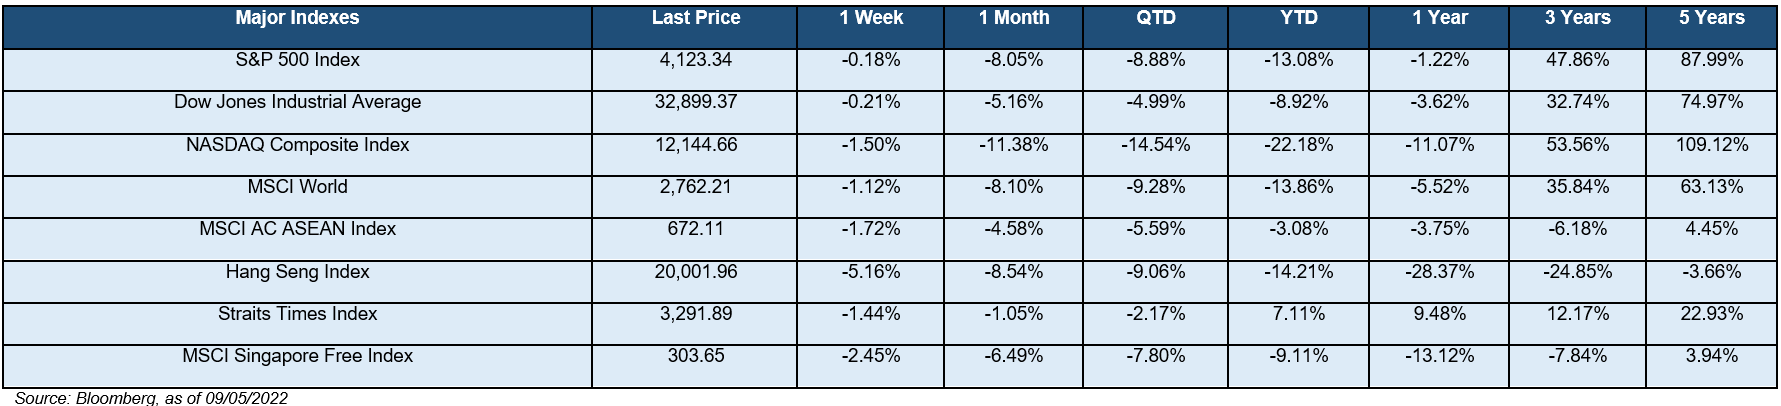
 The stock market continued to decline for five consecutive weeks. Growth stocks as loosely represented by the NASDAQ Composite (-1.50%) fared worst, followed by the Dow Jones Industrial Average (-0.21%) and the S&P 500 (-0.18%) respectively. Closer to home, both the STI (-1.44%) and the Hang Seng index (-5.16%) ended the week in the negative territory as well. We saw mixed returns from the S&P 500 sectors with the top performers being Energy (+6.51%), Financials (+2.85%), and Utilities (+1.83%). The bottom three sectors in the other hand, were Consumer Discretionary (-4.67%), InfoTech (-2.12%), and Communication Services (-1.33%).
On Wednesday, the U.S. Federal Reserve raised its benchmark short-term interest rate by 0.50%, the largest since 2000, while also signaling that more half-point increases are on the table for all remaining meetings this year. Initially, the market reacted positively after the comments that the Fed was not considering raising interest rates by 0.75%, but quickly retreated the next day as worries loomed on the impact to the economy. As a result, Tech stocks were particularly hard-hit as investors pulled back further on their estimates and valuations. Meanwhile, there were no positive developments in the Ukraine-Russia conflict.
The Consumer Price Index published monthly by the U.S. Bureau of Labor Statistics (BLS) had indicated that the U.S. inflation rate by the end of March had increased by 1.2% MoM to reach 8.5%. This is more than four times above the Fed’s 2% target and the highest we have seen since 1982’s 8.4%. The rate is expected to climb due to the high energy prices. Strong consumer demand, shortages of supplies such as semiconductors, and supply-chain constraints caused by the sporadic pandemic outbreaks had also elevated inflation for the past year. The high inflation has been the main driver for an increase in interest rate, which was suppressed to stimulate economic growth during the pandemic. However, hawkish rate hikes usually slowed economic growth and present the possibility of a recession if the rate is increased too far.
The yield-curve steepened last week as the 10Y-2Y US Treasury yield increased by 18 bps to 0.40%. The U.S. 2-year Treasury yields had increased slightly by 2 bps to reach 2.73% while the 10-year also increased by 20 bps to 3.13% (the first time since 2018). The overall stock market sentiment remained in risk-off mode and volatile as the global High Yield (HY) – Investment Grade (IG) spread continued to widen by 24 bps to 2.68% while the CBOE Volatility Index (VIX) fell by 321 bps to 30.19%. Both are well over their 20-day exponential moving averages of 2.34% and 26.00% respectively.
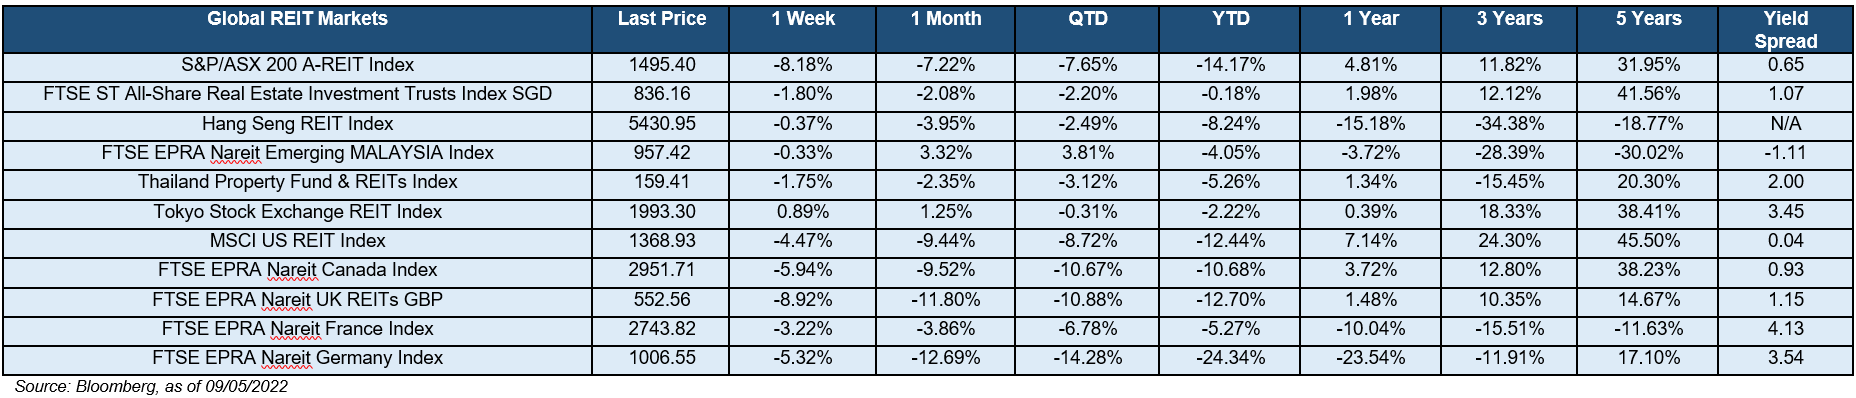
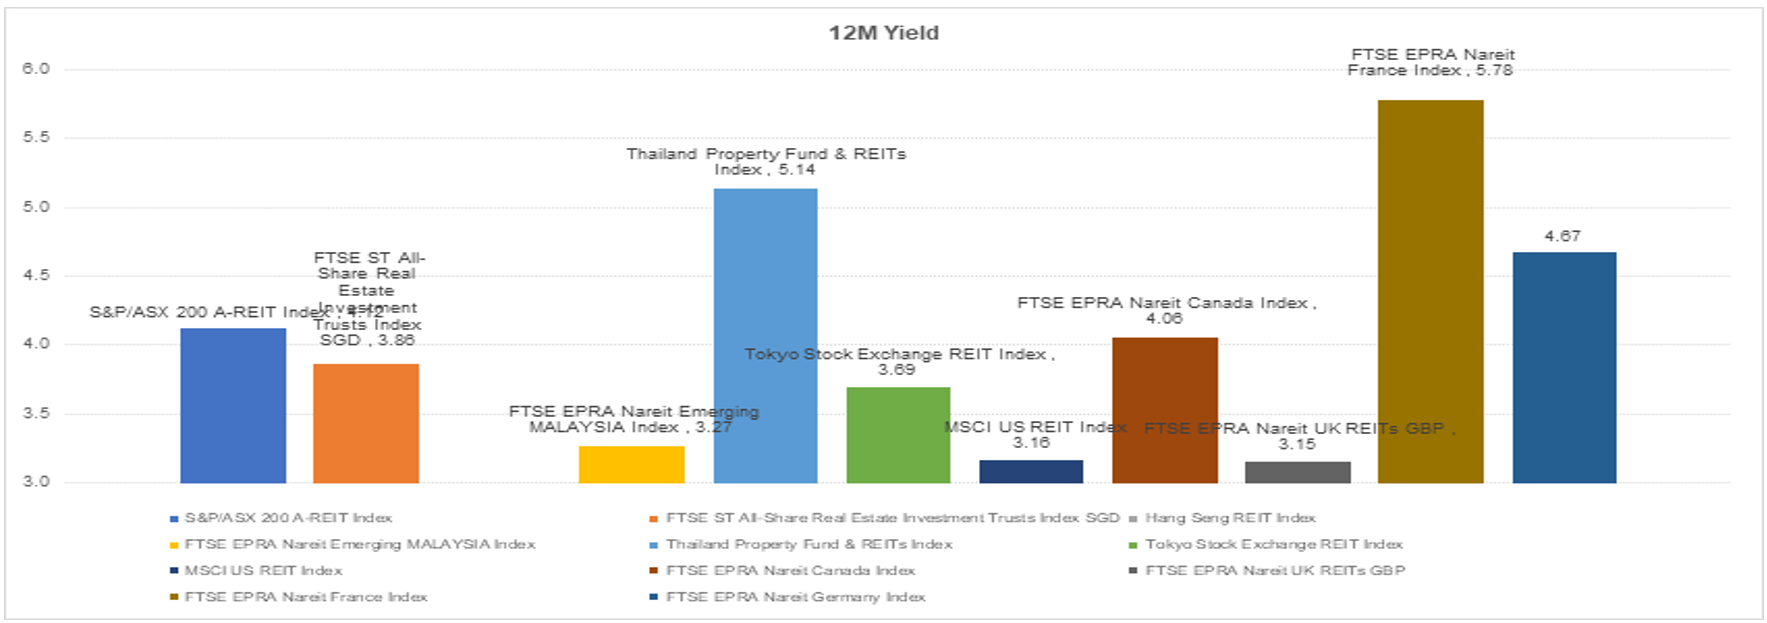
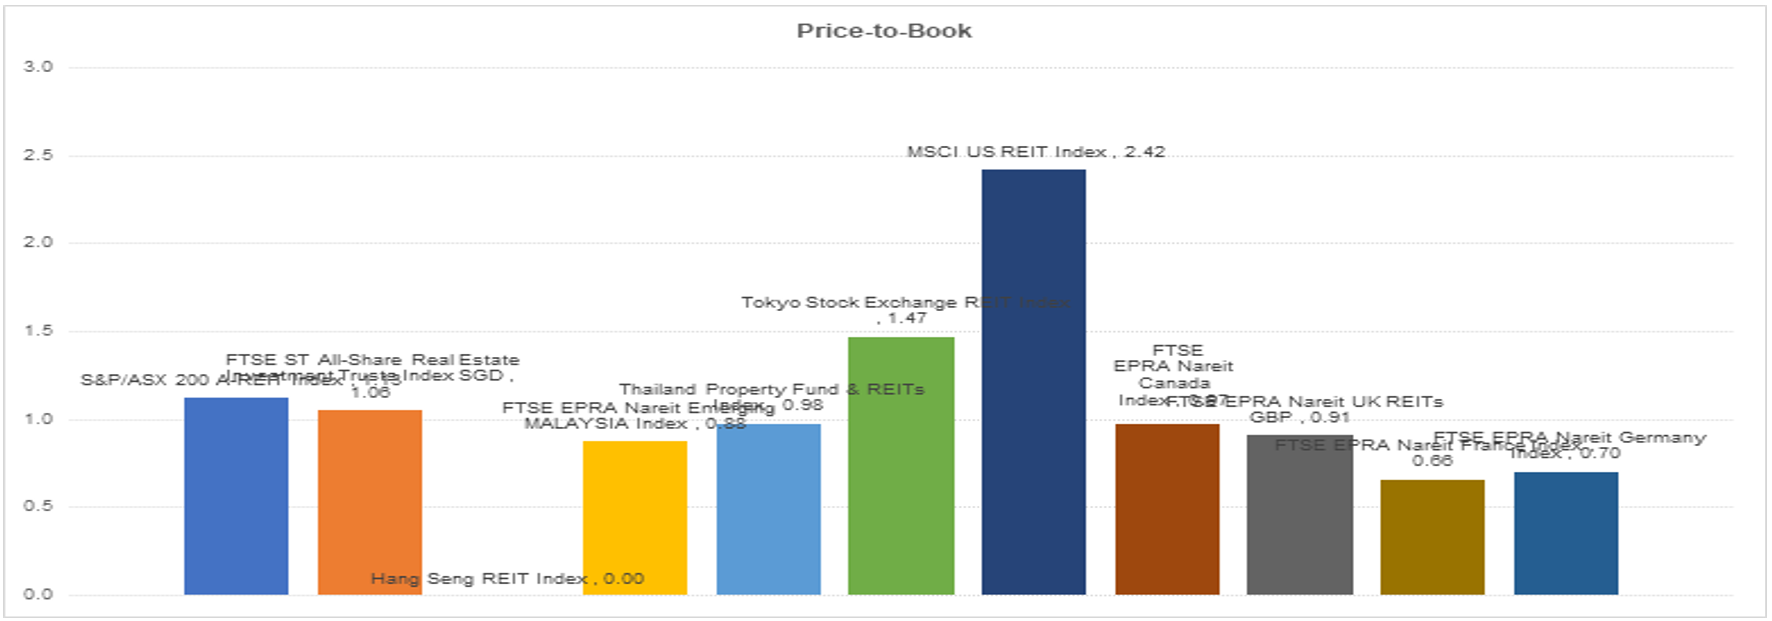
 As can be seen below, weekly performance from the global REIT markets were mostly mixed. However, the overall 12-month yield spreads are also mostly positive and favorable towards REIT’s forward total return. Back at home, the iEdge S-REIT Index (-1.85%) and all of the S-REIT sectors reported negative returns, with the exception of Hospitality (+0.80%). Healthcare (-0.34%) also relatively fared better. The bottom two S-REIT sectors in the other hand, were Industrial (-2.32%) and Office (-2.08%). With regards to the pandemic, the 7-day moving average of total COVID-19 cases gained a slight uptick to 2.7 thousand cases from 2.4 thousand the previous week. The number is still high and will likely remain this way as most of the COVID measures had been removed two weeks ago.
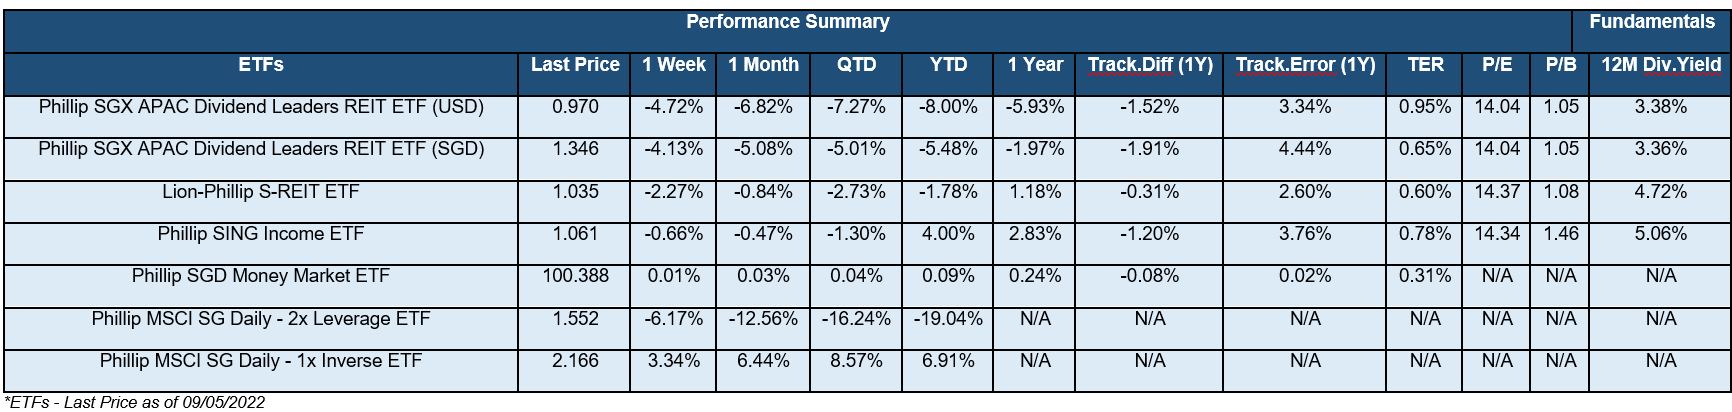
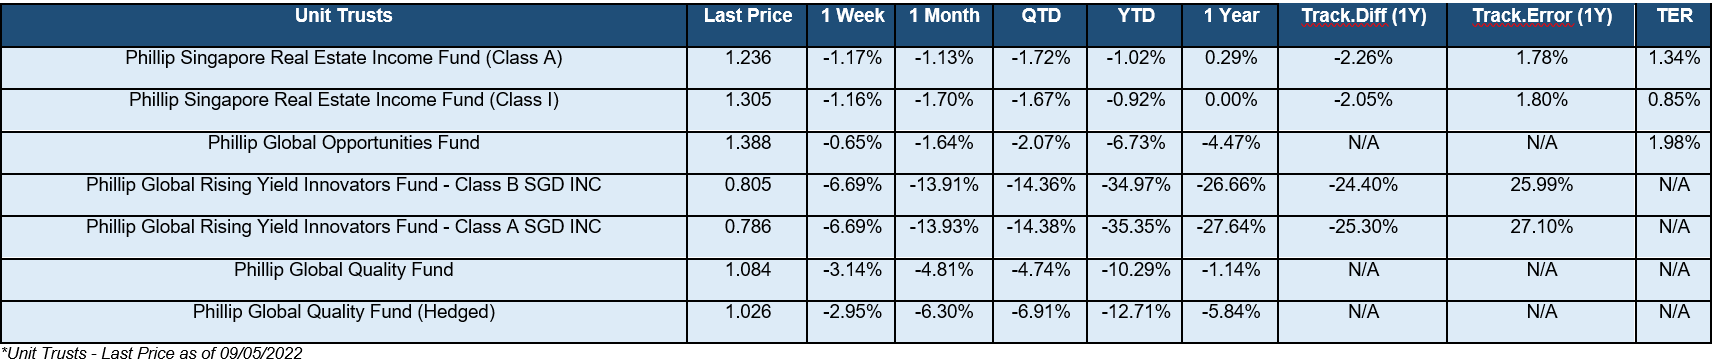
The Phillip SGX APAC Dividend Leaders REIT ETF (-4.72%), Lion-Phillip S-REIT ETF (-2.27%), Phillip Singapore Real Estate Income Fund (-1.17%), and Phillip SING Income ETF (-0.66%) are definitely attractive amidst current inflation and interest rate worries in the market. This is because the underlying real estate values and rentals will increase along with rising prices and outweigh the negative impact caused by rising interest rates. Globally, REIT is also the best inflation-adjusted asset classes for the past 20 years. US-REIT dividend growth have outpaced annual inflation rate as measured by the Consumer Price Index except in 2002 and 2009 (shortly after the GFC). In Singapore, the iEdge S-REIT Index has returned 5.86% annualized for the past ten years in contrast to the average core inflation rate of 1.37%, outperforming the STI’s 3.79%. The Lion-Phillip S-REIT ETF has also returned 4.49% annualized (5.09% before fund expenses) since its inception in October of 2017, outpacing the average inflation rate of 0.59% and the STI’s 3.28% for the same time period. Furthermore, our S-REIT ETF and Unit Trust are the best way to get coverage for S-REITs as individual REITs may have more rights issues that are costlier than the dividends that they pay.
Important Information
This material is provided by Phillip Capital Management (S) Ltd (“PCM”) for general information only and does not constitute a recommendation, an offer to sell, or a solicitation of any offer to invest in any of the exchange-traded fund (“ETF”) or the unit trust (“Products”) mentioned herein. It does not have any regard to your specific investment objectives, financial situation and any of your particular needs. You should read the Prospectus and the accompanying Product Highlights Sheet (“PHS”) for key features, key risks and other important information of the Products and obtain advice from a financial adviser (“FA“) before making a commitment to invest in the Products. In the event that you choose not to obtain advice from a FA, you should assess whether the Products are suitable for you before proceeding to invest. A copy of the Prospectus and PHS are available from PCM, any of its Participating Dealers (“PDs“) for the ETF, or any of its authorised distributors for the unit trust managed by PCM.
An ETF is not like a typical unit trust as the units of the ETF (the “Units“) are to be listed and traded like any share on the Singapore Exchange Securities Trading Limited (“SGX-ST”). Listing on the SGX-ST does not guarantee a liquid market for the Units which may be traded at prices above or below its NAV or may be suspended or delisted. Investors may buy or sell the Units on SGX-ST when it is listed. Investors cannot create or redeem Units directly with PCM and have no rights to request PCM to redeem or purchase their Units. Creation and redemption of Units are through PDs if investors are clients of the PDs, who have no obligation to agree to create or redeem Units on behalf of any investor and may impose terms and conditions in connection with such creation or redemption orders. Please refer to the Prospectus of the ETF for more details.
Investments are subject to investment risks including the possible loss of the principal amount invested, and are not obligations of, deposits in, guaranteed or insured by PCM or any of its subsidiaries, associates, affiliates or PDs. The value of the units and the income accruing to the units may fall or rise. Past performance is not necessarily indicative of the future or likely performance of the Products. There can be no assurance that investment objectives will be achieved. Any use of financial derivative instruments will be for hedging and/or for efficient portfolio management. PCM reserves the discretion to determine if currency exposure should be hedged actively, passively or not at all, in the best interest of the Products. The regular dividend distributions, out of either income and/or capital, are not guaranteed and subject to PCM’s discretion. Past payout yields and payments do not represent future payout yields and payments. Such dividend distributions will reduce the available capital for reinvestment and may result in an immediate decrease in the net asset value (“NAV”) of the Products. Please refer to <www.phillipfunds.com> for more information in relation to the dividend distributions.
The information provided herein may be obtained or compiled from public and/or third party sources that PCM has no reason to believe are unreliable. Any opinion or view herein is an expression of belief of the individual author or the indicated source (as applicable) only. PCM makes no representation or warranty that such information is accurate, complete, verified or should be relied upon as such. The information does not constitute, and should not be used as a substitute for tax, legal or investment advice.
The information herein are not for any person in any jurisdiction or country where such distribution or availability for use would contravene any applicable law or regulation or would subject PCM to any registration or licensing requirement in such jurisdiction or country. The Products is not offered to U.S. Persons. PhillipCapital Group of Companies, including PCM, their affiliates and/or their officers, directors and/or employees may own or have positions in the Products. This advertisement has not been reviewed by the Monetary Authority of Singapore.