
Weekly Commentary: 10 October 2022 – 16 October 2022
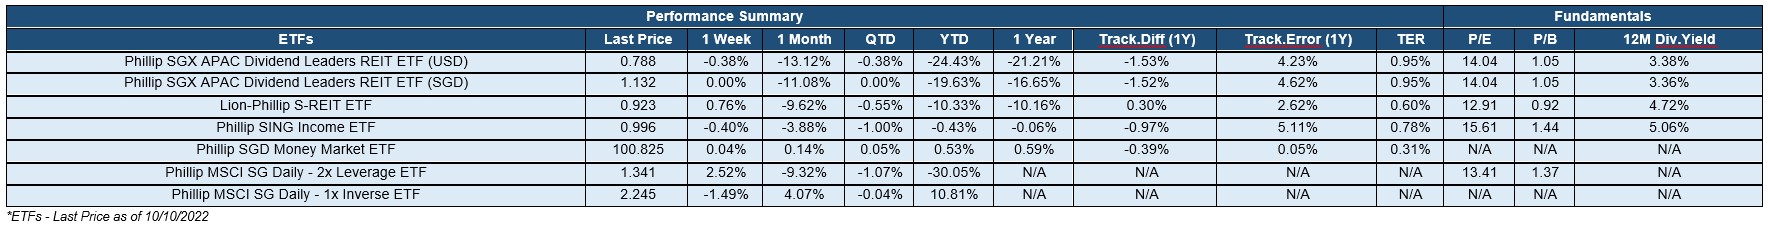

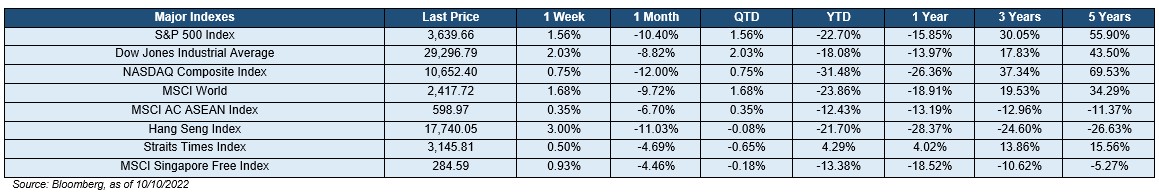
The stock market rebounded last week but surrendered most of its gains after September’s U.S jobs report showed a strengthened job market despite the Fed’s efforts to slow the economy. Nevertheless, stocks mostly ended higher by Friday. Value as loosely represented by the Dow Jones Industrial Average (+2.03%) had the best gain last week, with the S&P 500 (+1.56%) and the NASDAQ Composite Index (+0.75%) trailing closely behind. Other key market indices including the STI (+0.50%) and Hang Seng (+3.00%) reported positive returns as well. All eleven S&P 500 sectors saw mixed returns with Real Estate (-4.06%), Utilities (-2.63%), and Consumer Discretionary (-1.11%) relatively underperforming the rest. In contrast, Energy (+13.86%), Industrials (+2.87%), and Materials (+2.15%) were the top three sectors. Energy outperformed after OPEC+ announced a major reduction in oil production, driving both WTI and Brent crude up last week.
The market focus next will be on the 3Q22 earnings season announcements and the U.S. September Consumer Price Index (CPI) data that will be released later this week. Overall market sentiment is still largely centred around recession and rate hike expectations, especially after the stubbornly elevated inflation data in August. The Fed’s preferred inflation gauge – the U.S. Personal Consumption Expenditure (PCE), has its headline rate decreased by 0.20 pp to 6.20% YoY in August. However, inflationary pressure persists as core PCE climbed by 0.20 pp to 4.90% YoY, well above the Fed’s target range of 2%. The U.S. core CPI had also accelerated to 6.3% YoY, from 5.9% in August. Globally, rising energy prices remained a concern as it is the primary driving force behind the rising inflation level. Singapore’s CPI in August has accelerated by 0.5 pp MoM to 7.5% YoY, the highest since the GFC, while MAS core inflation also moved up by 0.3 pp to 5.1% YoY. Three weeks ago, the U.S. Federal Reserve announced a 75 bps hike on its benchmark interest rate, elevating the target range to 3.00%-3.25%, the highest since March 2008. The market is currently pricing in a more aggressive Fed as its monetary tightening seemed to have yield little effectiveness so far.
The yield-curve continued to be inverted as the 10Y-2Y US Treasury spread slipped by 1.2 bps to -0.43% last week. Both the U.S 2-year and 10-year Treasury yields surged by 10 bps and 9 bps to 4.31% and 3.88% respectively. The stock market remained largely risk-off and volatile, although the U.S. High Yield (HY) – Investment Grade (IG) spread contracted by 49 bps to 3.44% and the CBOE Volatility Index (VIX) fell by 26 bps to 31.36%.
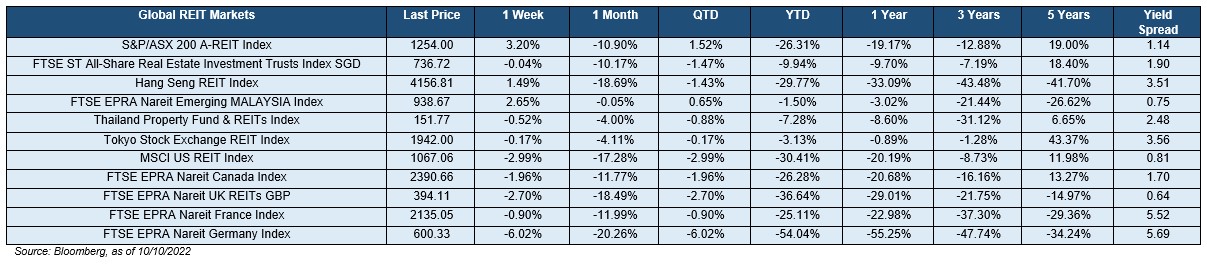
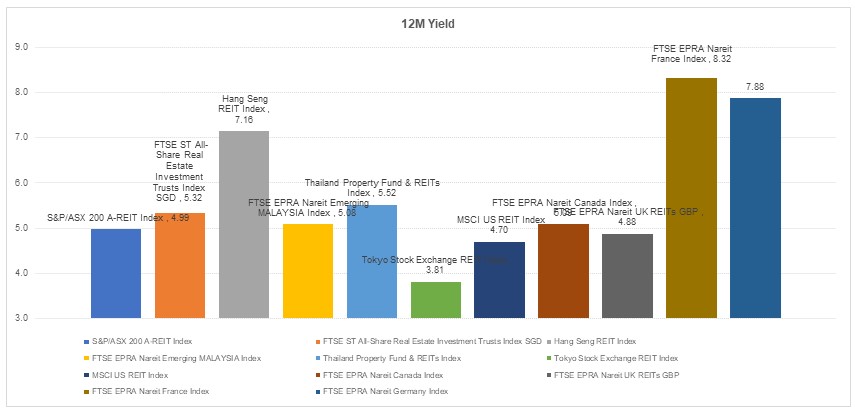
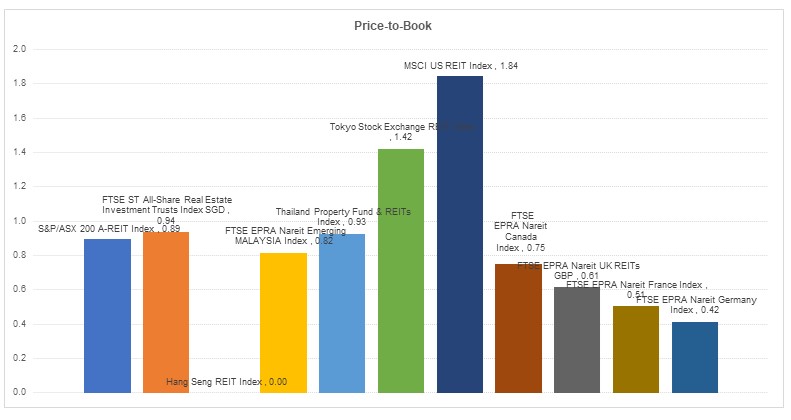
As can be seen below, most of the global REIT markets delivered negative returns with the exception of Australia, Hong Kong, and Malaysia. However, the overall 12-month yield spreads remained positive and favorable towards forward total returns. Back at home, the iEdge S-REIT Index’s (+0.03%) subsectors reported mixed returns with Office (-1.77%) and Specialized/Pureplay DCs (-1.38%) faring the worst. In contrast, Diversified (+1.15%) and Retail (+0.87%) were the top two subsectors. The sectors overall continued to be punished due to decreasing yield spread as interest rates surged and investors pricing in the possibility of reduced distributions from the increased financing costs. With regards to the pandemic, the 7-day moving average of total COVID-19 cases surged to around 5000 cases last week. However, there were no further announced changes to the current COVID-19 measures.
Important Information
This material is provided by Phillip Capital Management (S) Ltd (“PCM”) for general information only and does not constitute a recommendation, an offer to sell, or a solicitation of any offer to invest in any of the exchange-traded fund (“ETF”) or the unit trust (“Products”) mentioned herein. It does not have any regard to your specific investment objectives, financial situation and any of your particular needs. You should read the Prospectus and the accompanying Product Highlights Sheet (“PHS”) for key features, key risks and other important information of the Products and obtain advice from a financial adviser (“FA“) before making a commitment to invest in the Products. In the event that you choose not to obtain advice from a FA, you should assess whether the Products are suitable for you before proceeding to invest. A copy of the Prospectus and PHS are available from PCM, any of its Participating Dealers (“PDs“) for the ETF, or any of its authorised distributors for the unit trust managed by PCM.
An ETF is not like a typical unit trust as the units of the ETF (the “Units“) are to be listed and traded like any share on the Singapore Exchange Securities Trading Limited (“SGX-ST”). Listing on the SGX-ST does not guarantee a liquid market for the Units which may be traded at prices above or below its NAV or may be suspended or delisted. Investors may buy or sell the Units on SGX-ST when it is listed. Investors cannot create or redeem Units directly with PCM and have no rights to request PCM to redeem or purchase their Units. Creation and redemption of Units are through PDs if investors are clients of the PDs, who have no obligation to agree to create or redeem Units on behalf of any investor and may impose terms and conditions in connection with such creation or redemption orders. Please refer to the Prospectus of the ETF for more details.
Investments are subject to investment risks including the possible loss of the principal amount invested, and are not obligations of, deposits in, guaranteed or insured by PCM or any of its subsidiaries, associates, affiliates or PDs. The value of the units and the income accruing to the units may fall or rise. Past performance is not necessarily indicative of the future or likely performance of the Products. There can be no assurance that investment objectives will be achieved. Any use of financial derivative instruments will be for hedging and/or for efficient portfolio management. PCM reserves the discretion to determine if currency exposure should be hedged actively, passively or not at all, in the best interest of the Products. The regular dividend distributions, out of either income and/or capital, are not guaranteed and subject to PCM’s discretion. Past payout yields and payments do not represent future payout yields and payments. Such dividend distributions will reduce the available capital for reinvestment and may result in an immediate decrease in the net asset value (“NAV”) of the Products. Please refer to <www.phillipfunds.com> for more information in relation to the dividend distributions.
The information provided herein may be obtained or compiled from public and/or third party sources that PCM has no reason to believe are unreliable. Any opinion or view herein is an expression of belief of the individual author or the indicated source (as applicable) only. PCM makes no representation or warranty that such information is accurate, complete, verified or should be relied upon as such. The information does not constitute, and should not be used as a substitute for tax, legal or investment advice.
The information herein are not for any person in any jurisdiction or country where such distribution or availability for use would contravene any applicable law or regulation or would subject PCM to any registration or licensing requirement in such jurisdiction or country. The Products is not offered to U.S. Persons. PhillipCapital Group of Companies, including PCM, their affiliates and/or their officers, directors and/or employees may own or have positions in the Products. This advertisement has not been reviewed by the Monetary Authority of Singapore.