
Weekly Commentary: 18 Sep 2023 – 24 Sep 2023

Returns were mixed last week across the various indexes. CPI Index rose 0.6% in August from the prior month, with more than half of the increase due to higher gasoline prices. So-called core prices, which exclude volatile food and energy items, rose by a relatively mild 0.3% last month after even lower readings in June and July. The FED seems likely to hold interest rates steady at their meeting next week. Inflation is proving to be resilient as retail spending rose at the fastest pace since the start of the year. Retail sales rose at a seasonally adjusted 0.7% in July from the prior month. The retail sales gain was also higher than the 0.2% increase in consumer prices last month.
In China, economic activities appeared to improve as growth in retail sales rose to 4.6% from a year earlier, from just 2.5% in July, while unemployment ticked down marginally. Industrial production rose 4.5% in August yoy, gaining from the 3.7% increase in July. China has been trying to prop up the economy by cutting the reserve requirement ratio for banks by 0.25% to 7.4%, adding liquidity to the financial system. Big cities have also removed price restrictions on home purchases, including reducing minimum mortgage interest rates and down payments to boost the property sector. However, structural issues about the economy remain as youth unemployment remains an issue for them.
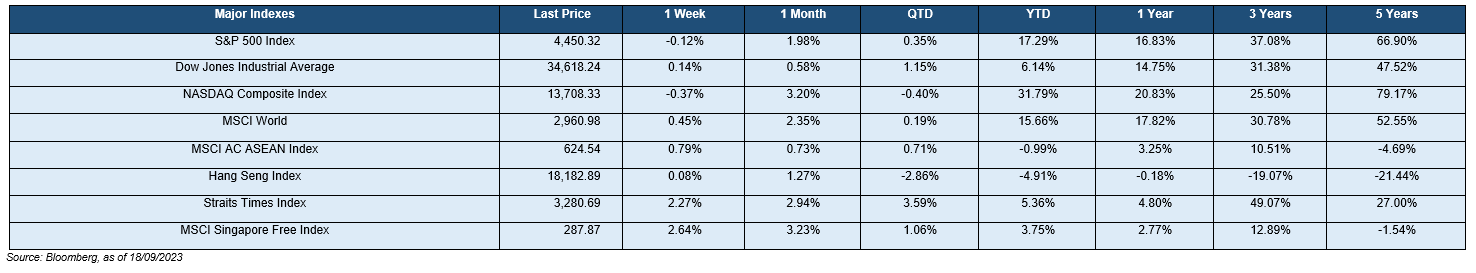
Stock returns were mixed over the week as observed across the following 3 indices, with the Dow Jones Industrial Average (+0.14%), S&P 500 Index (-0.12%), and NASDAQ Composite Index (-0.37%). Other notable key market indices that generated positive returns consist of MSCI World (+0.45%) & Hang Seng Index (+0.08%). All S&P 500 sectors registered mixed returns last week with notable sectors – Information Technology (-2.23%), Industrials (-0.59%), and Materials (-0.11%) falling more than the rest of the sector. For 2022, index returns were negative for the Dow Jones Industrial Average (-8.78%), S&P 500 (-19.44%), and the NASDAQ Composite (-33.10%).
The yield-curve remains inverted as the 10Y-2Y US Treasury spread tightened to -0.70%. driven by U.S 2-year and 10-year Treasury yields rising 3 bps to 5.03% and rising 7 bps to 4.33% respectively. Market sentiment also became more risk-off as the U.S. High Yield (HY) – Investment Grade (IG) credit spread widened 3 bps to 2.56% while the CBOE Volatility Index (VIX) fell 5 bps to 13.79%.
This coming week, The FED, BOE, and BOJ will announce its rate decision. China will also announce it’s policy rate decision and the UK’s August retail sales figures will be out.
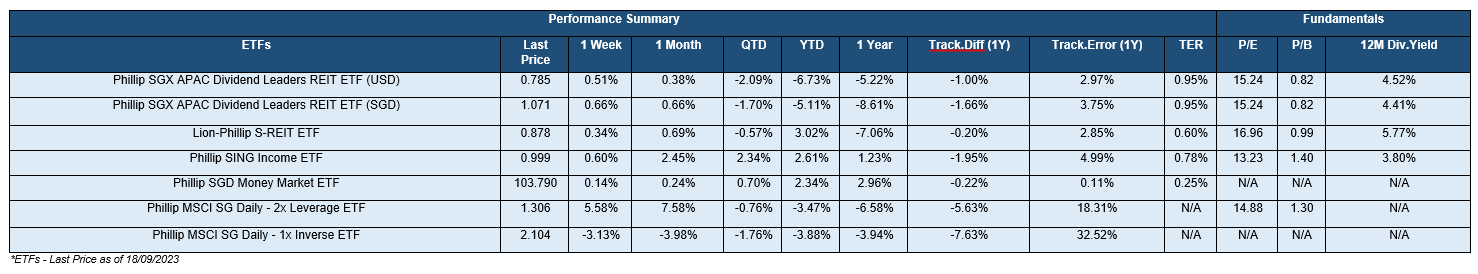
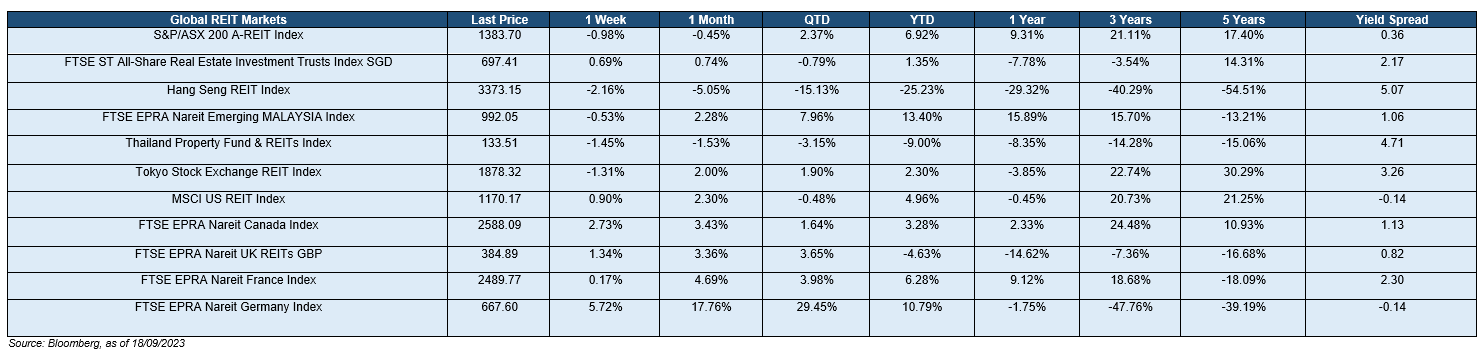
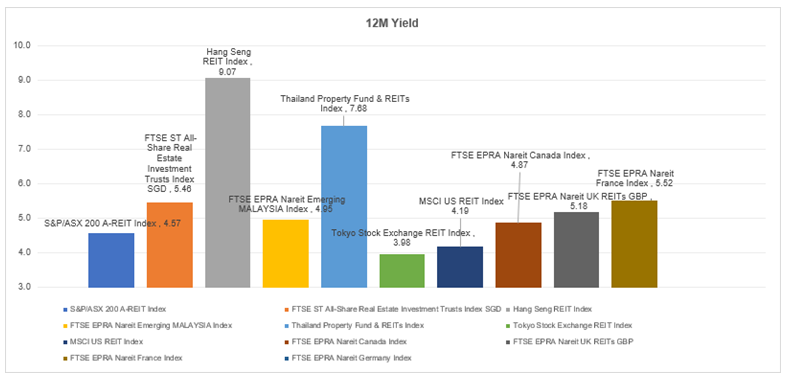
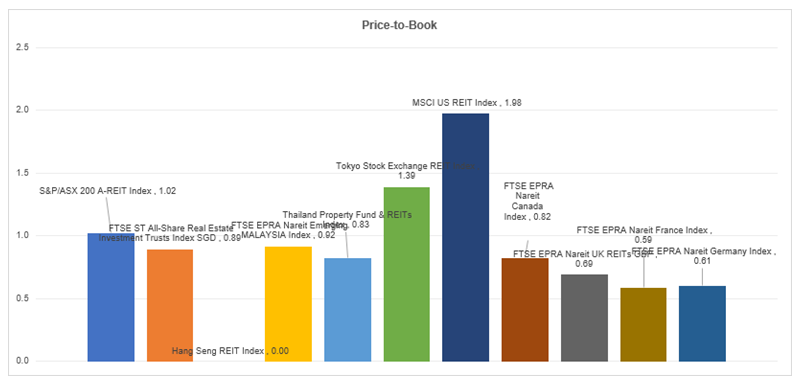
The global REITs market’s return were mostly in the mix across the numerous benchmarks. Thailand Property Fund & REITs Index (-1.45%), Hang Seng REIT Index (-2.16%), and Tokyo Stock Exchange REIT Index (-1.31%) are the notable REITs that generated negative returns over the past week. Closer to home, the iEdge S-REIT Index (+0.69%) and most of its subsectors generated mixed weekly returns with Retail REITS (+1.84%) and Data Center REITs (+0.69%), the notable sector that outperformed the rest last week. REITs generally have been affected by decreasing yield spread as interest rates surged and investors price in the possibility of reduced distributions stemming from higher financing costs. However, we do expect inflows to return to the sector given the existing attractive valuations on offer and resilience offered by the REIT asset class in light of the waning global growth outlook.
Important Information
This material is provided by Phillip Capital Management (S) Ltd (“PCM”) for general information only and does not constitute a recommendation, an offer to sell, or a solicitation of any offer to invest in any of the exchange-traded fund (“ETF”) or the unit trust (“Products”) mentioned herein. It does not have any regard to your specific investment objectives, financial situation and any of your particular needs. You should read the Prospectus and the accompanying Product Highlights Sheet (“PHS”) for key features, key risks and other important information of the Products and obtain advice from a financial adviser (“FA“) before making a commitment to invest in the Products. In the event that you choose not to obtain advice from a FA, you should assess whether the Products are suitable for you before proceeding to invest. A copy of the Prospectus and PHS are available from PCM, any of its Participating Dealers (“PDs“) for the ETF, or any of its authorised distributors for the unit trust managed by PCM.
An ETF is not like a typical unit trust as the units of the ETF (the “Units“) are to be listed and traded like any share on the Singapore Exchange Securities Trading Limited (“SGX-ST”). Listing on the SGX-ST does not guarantee a liquid market for the Units which may be traded at prices above or below its NAV or may be suspended or delisted. Investors may buy or sell the Units on SGX-ST when it is listed. Investors cannot create or redeem Units directly with PCM and have no rights to request PCM to redeem or purchase their Units. Creation and redemption of Units are through PDs if investors are clients of the PDs, who have no obligation to agree to create or redeem Units on behalf of any investor and may impose terms and conditions in connection with such creation or redemption orders. Please refer to the Prospectus of the ETF for more details.
Investments are subject to investment risks including the possible loss of the principal amount invested, and are not obligations of, deposits in, guaranteed or insured by PCM or any of its subsidiaries, associates, affiliates or PDs. The value of the units and the income accruing to the units may fall or rise. Past performance is not necessarily indicative of the future or likely performance of the Products. There can be no assurance that investment objectives will be achieved. Any use of financial derivative instruments will be for hedging and/or for efficient portfolio management. PCM reserves the discretion to determine if currency exposure should be hedged actively, passively or not at all, in the best interest of the Products. The regular dividend distributions, out of either income and/or capital, are not guaranteed and subject to PCM’s discretion. Past payout yields and payments do not represent future payout yields and payments. Such dividend distributions will reduce the available capital for reinvestment and may result in an immediate decrease in the net asset value (“NAV”) of the Products. Please refer to <www.phillipfunds.com> for more information in relation to the dividend distributions.
The information provided herein may be obtained or compiled from public and/or third party sources that PCM has no reason to believe are unreliable. Any opinion or view herein is an expression of belief of the individual author or the indicated source (as applicable) only. PCM makes no representation or warranty that such information is accurate, complete, verified or should be relied upon as such. The information does not constitute, and should not be used as a substitute for tax, legal or investment advice.
The information herein are not for any person in any jurisdiction or country where such distribution or availability for use would contravene any applicable law or regulation or would subject PCM to any registration or licensing requirement in such jurisdiction or country. The Products is not offered to U.S. Persons. PhillipCapital Group of Companies, including PCM, their affiliates and/or their officers, directors and/or employees may own or have positions in the Products. This advertisement has not been reviewed by the Monetary Authority of Singapore.