
Weekly Commentary: 16 Oct 2023 – 22 Oct 2023

Major US equity benchmarks were mixed for the past week Inflation seems to be abating. In the UK, house prices have fallen by 2.8% in nominal terms since their peak in March 2022 however, if you measure it in real terms, the figure shoots up to 13.4%. In some regions and nations of the UK, house prices have yet to recover to 2007 levels after adjusting for inflation. Grocery inflation has also fallen for 7th consecutive month. Grocery prices rose by an annual rate of 11%, down from 12.2% the previous month and the lowest since July 2022. Food inflation was one of the drivers of rising prices in the UK, and the fall in prices suggests that cost of living pressures are beginning to ease. Recession fears are abating, and economists think that the days of raising interest rates are gone and inflation will continue to abate. Strong labour market resilience and rising real incomes support their thesis coupled with declining inflation.
In China, even though its economy is in the doldrums, its movie theatres enjoyed a record-breaking few months as box office receipts totaled 23.44 billion yuan between June and September, the highest amount for that period in history. During the traditional high season between June and August, it soared to a record 20.6 billion yuan. The movie industry usually does well in tough economic times as moviegoers can escape reality with just a small sum of money compared to cars and houses.
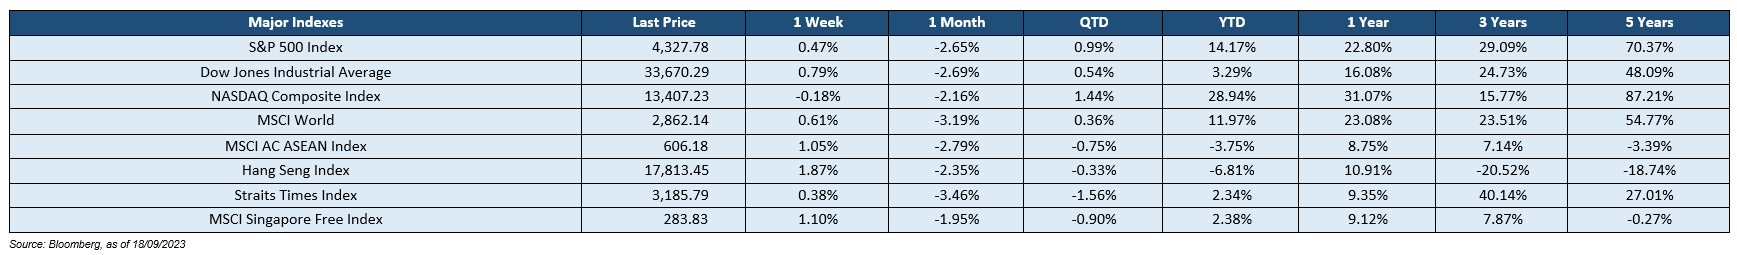
Stock returns were mixed over the week as observed across the following 3 indices, with the Dow Jones Industrial Average (+0.79%), S&P 500 Index (+0.47%), and NASDAQ Composite Index (-0.18%). Other notable key market indices that generated positive returns consist of the MSCI AC ASEAN Index (+1.05%) & Hang Seng Index (+1.87%). All S&P 500 sectors registered mixed returns last week with notable sectors – Utilities (+3.61%), Energy (+4.51%), and Real Estate (+2.37%) falling more than the rest of the sector. For 2022, index returns were negative for the Dow Jones Industrial Average (-8.78%), S&P 500 (-19.44%), and the NASDAQ Composite (-33.10%).
The yield curve remains inverted as the 10Y-2Y US Treasury spread widened to -0.41%. driven by U.S 2-year and 10-year Treasury yields falling 2 bps to 5.06% and falling 15 bps to 4.65% respectively. Market sentiment also became more risk-on as the U.S. High Yield (HY) – Investment Grade (IG) credit spread tightened 9 bps to 2.88% while the CBOE Volatility Index (VIX) rose 187 bps to 19.32%.
This coming week, the UK’s monthly unemployment rate and average weekly earnings, September CPI, PPI, and retail price index (RPI) inflation rate data, and the US’s September retail sales figures will be released.
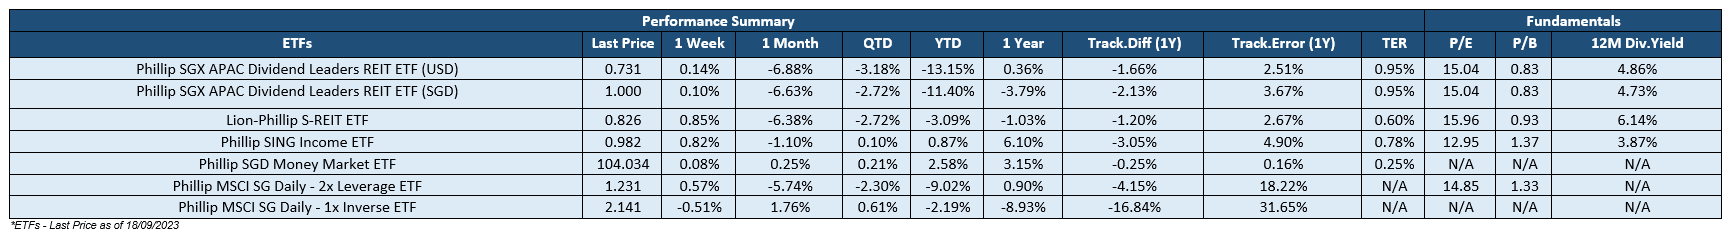
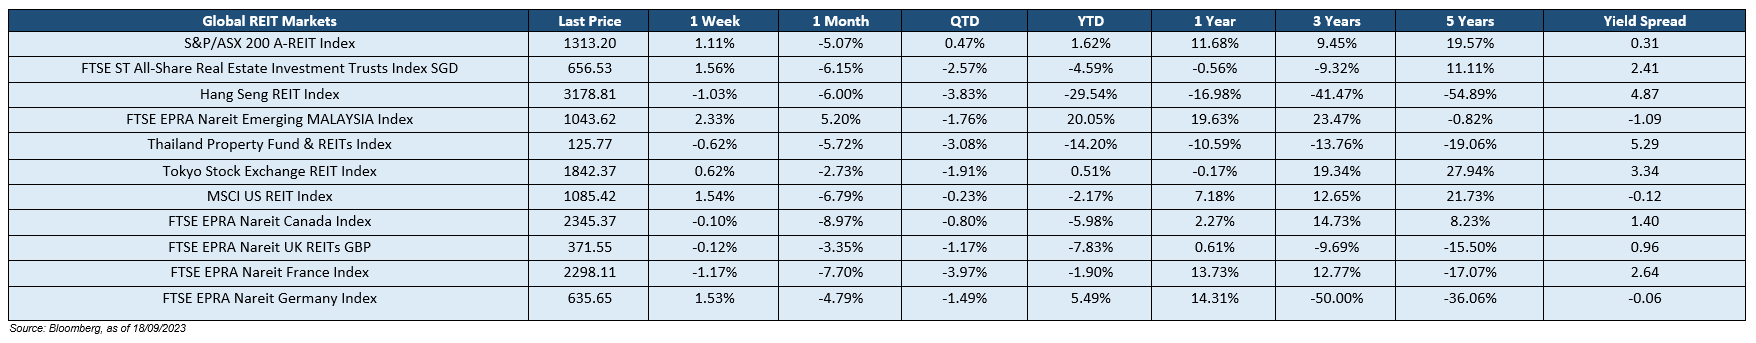
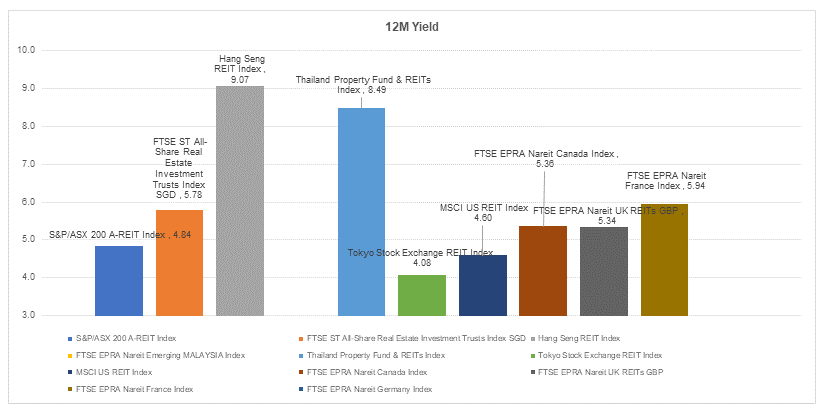
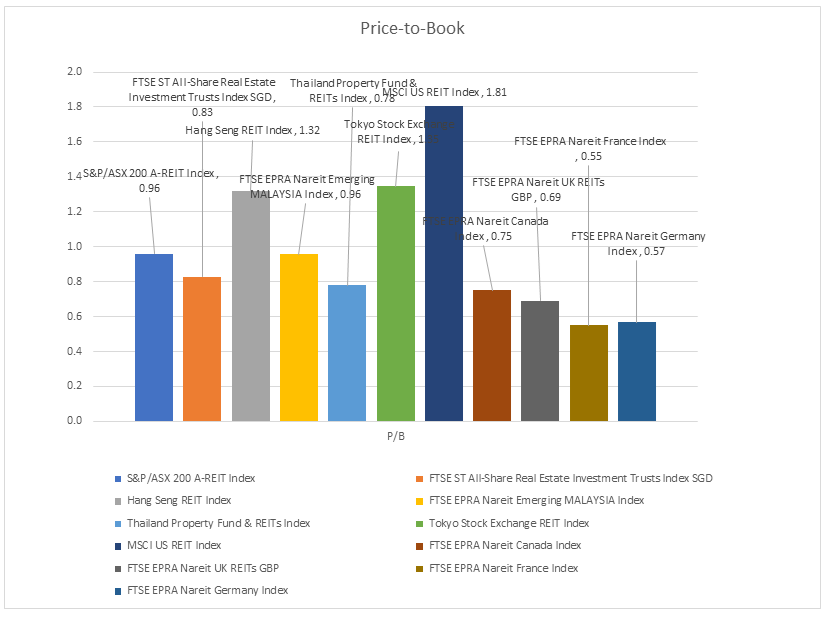
 The global REITs market’s returns were mostly in the red across the numerous benchmarks. Hang Seng REIT Index (-1.03%) and FTSE EPRA Nareit France Index (-1.17%) are the notable REITs that generated negative returns over the past week. Closer to home, the iEdge S-REIT Index (+1.48 %) and most of its subsectors generated positive weekly returns with Real Estate Operating Companies (+2.88%) and Industrial REITs (+1.79%), the notable sector that underperformed the rest last week. REITs generally have been affected by decreasing yield spread as interest rates surged and investors price in the possibility of reduced distributions stemming from higher financing costs. However, we expect inflows to return to the sector given the existing attractive valuations on offer and resilience offered by the REIT asset class in light of the waning global growth outlook.
Important Information
This material is provided by Phillip Capital Management (S) Ltd (“PCM”) for general information only and does not constitute a recommendation, an offer to sell, or a solicitation of any offer to invest in any of the exchange-traded fund (“ETF”) or the unit trust (“Products”) mentioned herein. It does not have any regard to your specific investment objectives, financial situation and any of your particular needs. You should read the Prospectus and the accompanying Product Highlights Sheet (“PHS”) for key features, key risks and other important information of the Products and obtain advice from a financial adviser (“FA“) before making a commitment to invest in the Products. In the event that you choose not to obtain advice from a FA, you should assess whether the Products are suitable for you before proceeding to invest. A copy of the Prospectus and PHS are available from PCM, any of its Participating Dealers (“PDs“) for the ETF, or any of its authorised distributors for the unit trust managed by PCM.
An ETF is not like a typical unit trust as the units of the ETF (the “Units“) are to be listed and traded like any share on the Singapore Exchange Securities Trading Limited (“SGX-ST”). Listing on the SGX-ST does not guarantee a liquid market for the Units which may be traded at prices above or below its NAV or may be suspended or delisted. Investors may buy or sell the Units on SGX-ST when it is listed. Investors cannot create or redeem Units directly with PCM and have no rights to request PCM to redeem or purchase their Units. Creation and redemption of Units are through PDs if investors are clients of the PDs, who have no obligation to agree to create or redeem Units on behalf of any investor and may impose terms and conditions in connection with such creation or redemption orders. Please refer to the Prospectus of the ETF for more details.
Investments are subject to investment risks including the possible loss of the principal amount invested, and are not obligations of, deposits in, guaranteed or insured by PCM or any of its subsidiaries, associates, affiliates or PDs. The value of the units and the income accruing to the units may fall or rise. Past performance is not necessarily indicative of the future or likely performance of the Products. There can be no assurance that investment objectives will be achieved. Any use of financial derivative instruments will be for hedging and/or for efficient portfolio management. PCM reserves the discretion to determine if currency exposure should be hedged actively, passively or not at all, in the best interest of the Products. The regular dividend distributions, out of either income and/or capital, are not guaranteed and subject to PCM’s discretion. Past payout yields and payments do not represent future payout yields and payments. Such dividend distributions will reduce the available capital for reinvestment and may result in an immediate decrease in the net asset value (“NAV”) of the Products. Please refer to <www.phillipfunds.com> for more information in relation to the dividend distributions.
The information provided herein may be obtained or compiled from public and/or third party sources that PCM has no reason to believe are unreliable. Any opinion or view herein is an expression of belief of the individual author or the indicated source (as applicable) only. PCM makes no representation or warranty that such information is accurate, complete, verified or should be relied upon as such. The information does not constitute, and should not be used as a substitute for tax, legal or investment advice.
The information herein are not for any person in any jurisdiction or country where such distribution or availability for use would contravene any applicable law or regulation or would subject PCM to any registration or licensing requirement in such jurisdiction or country. The Products is not offered to U.S. Persons. PhillipCapital Group of Companies, including PCM, their affiliates and/or their officers, directors and/or employees may own or have positions in the Products. This advertisement has not been reviewed by the Monetary Authority of Singapore.