
Market Commentary – May 2026
EQUITY MARKET UPDATE
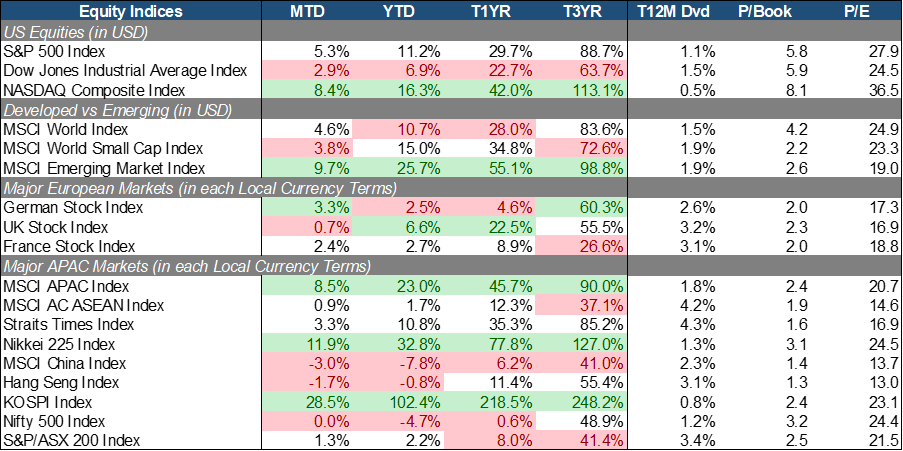
Source: Bloomberg (Total Return in USD/Local Currency terms)
U.S. equities delivered another strong month of growth led by AI and semiconductor stocks, causing broad domestic indices to reach fresh all-time highs. The NASDAQ Composite (+8.4% MoM) materially outperformed the S&P 500 (+5.3% MoM) and DJIA (+2.9% MoM), indicating that Growth significantly beat Value. A key catalyst for this rally was strong Q126 corporate financial results, which marked the most robust earnings expansion since 2021 as approximately 84% of S&P 500 firms beat market expectations. Massive AI infrastructure spending continued to anchor market leadership, directly benefiting hyperscalers and semiconductor companies as capital expenditure plans expanded to accommodate rising AI adoption. However, market leadership remained narrow and heavily concentrated within large-cap growth names because Treasury yields stayed elevated, driven by above-target inflation and reduced market expectations for short-term Federal Reserve interest rate cuts.
Europe posted positive but more moderate gains, participating in the global risk-on rally but ultimately lagged the U.S. and Asia due to weaker earnings momentum and less direct exposure to AI beneficiaries. German equities (+3.3% MoM) led the region’s performance, buoyed by improving investor sentiment toward the global manufacturing and semiconductor cycles which supported local industrial and tech-related sectors. Conversely, French equities (+2.4% MoM) experienced comparatively restrained gains as lingering domestic political and fiscal concerns weighed on investor confidence. Meanwhile, UK equities (+0.7% MoM) lagged the furthest behind, stymied by a structural lack of high-growth technology sectors, ongoing macroeconomic headwinds stemming from Brexit, and a broader structural shrinking of the London stock market.
APAC emerged as the standout region globally as the MSCI APAC Index surged (+8.5% MoM) to significantly outperform most developed market benchmarks, propelled by intense demand for semiconductors, AI infrastructure, and technology supply chains. South Korea (+28.5% MoM) and Japan (+11.9% MoM) stood out as the strongest-performing major markets worldwide. The South Korean market was overwhelmingly driven by a buying frenzy into AI semiconductor leaders, particularly high-bandwidth memory (HBM) beneficiaries like Samsung Electronics and SK Hynix. Japan also benefited from this global supply chain spillover into firms like Softbank and Ibiden, alongside strong domestic corporate earnings and optimism for pro-growth economic policies. In contrast, ASEAN markets finished flat, and China/HK (-3%/-1.7% MoM) lagged their regional peers significantly due to persistent anxieties surrounding domestic economic growth, a sluggish consumption recovery, and structural weakness in the property sector.
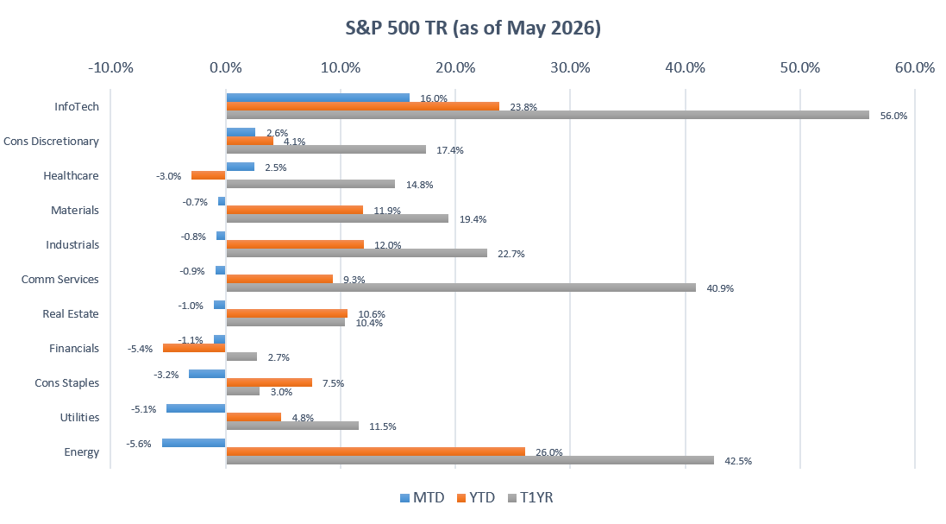 Source: Bloomberg (Total Return in USD terms)
Within S&P 500, Info Tech (+16.0% MoM), Consumer Discretionary (+2.6% MoM), and Healthcare (+2.5% MoM) were the top performing sectors for May. Info Tech surged as the definitive market leader, propelled directly by massive investments in AI infrastructure, anchored by robust corporate earnings that solidified investor confidence in a multi-year AI CapEx supercycle. Driven by an improving risk appetite and highly resilient consumer spending, Consumer Discretionary outperformed despite the headwinds of elevated interest rates. Healthy labour data and sustained wage growth provided a strong foundation, successfully offsetting macroeconomic concerns. Meanwhile, Healthcare staged a modest recovery as investors rotated capital into large-cap pharmaceutical and medical technology firms. This rebound marked a turning point after a prolonged period of sector underperformance earlier in the year, which had been triggered by intense regulatory uncertainty and pricing pressures.
In the other hand, Energy (-5.6% MoM), Utilities (-5.1% MoM), and Consumer Staples (-3.2% MoM) underperformed the broader market. Energy is weakest-performing sector for two consecutive months due to a widespread profit-taking as investors actively rotated capital out of commodities and into high-growth technology. Despite this pullback, Energy maintained its status as the strongest sector YTD (26.0%), even as softening commodity prices and easing supply disruption fears weighed on short-term performance. Utilities lagged significantly as a dominant risk-on market sentiment caused investors to aggressively abandon defensive, income-oriented assets. Rising bond yields and fading expectations for a near-term interest rate cut, have severely diminished the appeal of regulated utility dividends compared to growth stocks. Similarly, Consumer Staples falls to intense margin pressures stemming from sticky wage inflation and rising input costs. This drop was amplified by the prevailing risk-on environment.
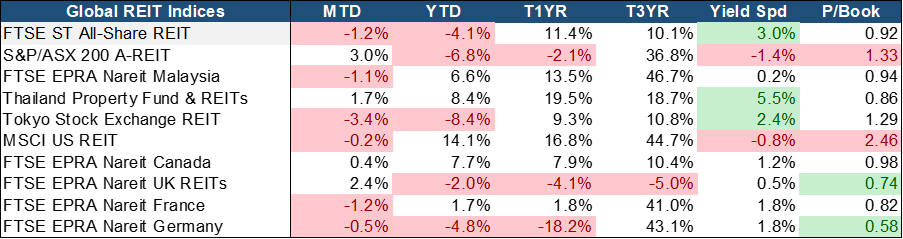
Source: Bloomberg (Total Return in Local Currency terms)
Global REIT markets delivered a mixed performance in May as investors balanced improving global monetary policy expectations against country-specific interest rate dynamics. Australian REITs (+3% MoM) led global performance, supported by resilient property fundamentals, easing inflation expectations, and growing confidence it is approaching the end of its tightening cycle. UK REITs (+2.4% MoM), Thailand REITs (+1.7% MoM), and Canadian REITs (+0.4% MoM) also posted gains, benefiting from declining bond yields and improving risk sentiment.
In contrast, Asian REIT markets were comparatively weaker. Japan REITs (-3.4% MoM) declined, making them the weakest-performing major REIT market, as investors continued to price in further policy normalization by the Bank of Japan and the prospect of rising domestic funding costs. Singapore REITs (-1.2% MoM) also retreated alongside France (-1.2% MoM), and Malaysia (-1.1% MoM), reflecting continued investor caution toward markets with relatively muted near-term earnings catalysts and lingering concerns surrounding refinancing costs.
Despite recent weakness, the investment case for S-REITs remains increasingly attractive. The sector continues to trade at approximately 0.92x Price-to-Book, representing a meaningful discount to historical averages and underlying asset values. More importantly, S-REITs offer one of the most attractive risk-adjusted income propositions globally, with a trailing dividend yield of 5.0% and a yield spread of 3.0%, among the highest across developed REIT markets. Fundamentals remain resilient across key subsectors. Industrial REITs continue to benefit from structural demand drivers including logistics modernization, e-commerce penetration, advanced manufacturing activity, and accelerating DC demand. Retail REITs are delivering healthy rental reversions supported by resilient consumer spending, stable occupancy levels, and limited new supply in suburban catchments. Meanwhile, balance sheets remain well-managed, with sector gearing levels largely stable and debt maturities well-laddered.
EQUITY MARKET OUTLOOK
Rates Backdrop and Market Sentiment:
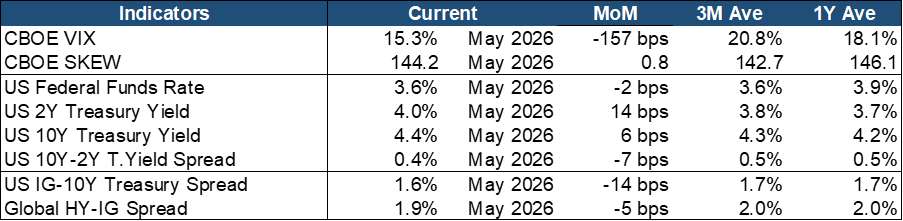
Source: Bloomberg.
Market confidence strengthened alongside resilient economic data and robust earnings momentum, which successfully depressed equity volatility. The VIX dropped to 15.3%, sliding comfortably below its three-month average of 20.8% and one-year average of 18.1% to signal a highly subdued near-term fear environment. However, underlying anxiety persisted as the SKEW index rose to 144.2 to sit well above its short-term historical average. This divergence reveals that while day-to-day market panic subsided, institutional investors actively boosted their protection against low-probability, high-impact tail-risk events.
Government bond yields advanced across all maturities, reflecting investor expectations for a prolonged restrictive interest rate environment and a potential long-term economic deceleration. Although the Federal Reserve held its policy rate steady at 3.6% for a third straight month, fixed-income markets experienced a distinct bear-flattening trend. The 10Y–2Y Treasury spread compressed by 7 bps to 0.4%, delivering a traditionally bearish signal for equities as investors priced in tighter monetary conditions. Simultaneously, the butterfly spread held negative at -0.2%, driven by a hawkish central bank elevating short-term yields while sticky inflation fears and massive government debt issuance simultaneously pressured long-term yields higher.
Corporate debt instruments rallied further to reinforce the broader risk-on sentiment dominant across global financial markets. Demand for credit risk triggered a 14 bps tightening in the IG–Treasury spread to 1.6%, while the Global HY–IG spread compressed by 5 basis points to 1.9%. Both key risk premiums dropped below their respective three-month and one-year historical trailing averages. This synchronized compression indicates powerful institutional confidence in corporate balance sheet health and a sharp reduction in perceived default risks across both investment-grade and high-yield issuers.
In essence, the constructive financial environment established in April extended its run in May, supported heavily by low equity volatility, tighter credit spreads, and highly resilient corporate earnings. Even though escalating Treasury yields presented a headwind, risk assets continued to attract capital as the broader market positioned heavily for an economic soft-landing scenario. Nevertheless, investors remained cautious; the combination of an elevated SKEW index, a flatter yield curve, and restrictive interest rates kept the market alert. Consequently, portfolios remained cautiously optimistic, expressing deep faith in immediate corporate growth while maintaining selective options hedges against sudden inflation, policy, or geopolitical shocks.
Macroeconomic Trends and Signals:
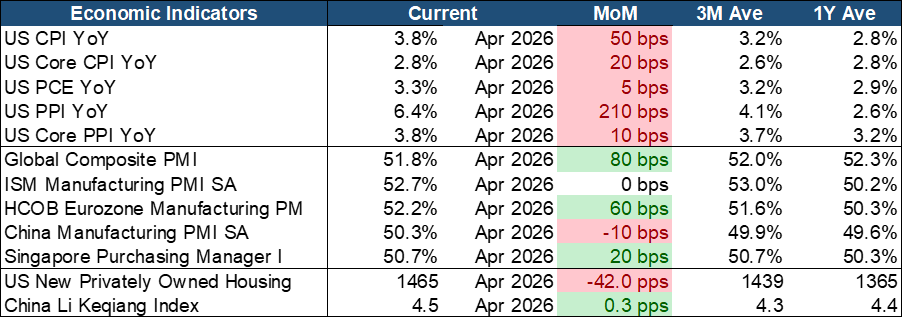
Source: Bloomberg.
Inflationary pressures reaccelerated during the month, raising concerns that the disinflation trend may be losing momentum. Headline CPI increased by 50 bps to 3.8% YoY, significantly above both its trailing three-month average of 3.2% and one-year average of 2.8%, while Core CPI rose 20 bps to 2.8%, suggesting inflationary pressures have broadened beyond traditionally volatile categories. Meanwhile, PCE inflation edged higher by 5 bps to 3.3% YoY, remaining well above the Federal Reserve’s 2% target and reinforcing expectations that policymakers will remain cautious on further rate cuts. Most notably, producer prices accelerated sharply, with PPI surging 210 bps to 6.4% YoY (Its highest level in more than a year) while Core PPI remained elevated at 3.8%, indicating that input cost pressures are rebuilding across the production chain and could eventually feed through into consumer inflation.
Despite restrictive financial conditions, global economic activity remained resilient, supported by a strengthening manufacturing cycle and healthy underlying demand. The Global Composite PMI improved to 51.8, signaling continued expansion across major economies. Growth was underpinned by a resilient U.S. manufacturing sector, which remained firmly in expansionary territory at 52.7, while Eurozone activity strengthened to 52.2, marking its highest level in several years. Although China’s manufacturing PMI eased slightly to 50.3, it continued to indicate expansion and points more toward stabilization than deterioration. Within Asia, Singapore’s PMI increased to 50.7, reflecting sustained regional trade and manufacturing momentum. Meanwhile, U.S. housing starts moderated 2.8% MoM to 1.47 million units following a strong rebound in March but remained comfortably above both their trailing three-month and one-year averages, highlighting the continued resilience of housing demand. Forward-looking indicators also remained constructive, with both the Global and U.S. OECD Composite Leading Indicators trending higher at 124.3 and 129.8, respectively, while China’s OECD CLI improved to 98.8 and the Li Keqiang Index accelerated to 4.5, supported by stronger freight activity, electricity consumption, and credit growth.
The combination of resilient economic growth and reaccelerating inflation continues to support a higher-for-longer macroeconomic environment. Manufacturing activity remains expansionary across most major economies, leading indicators are improving, and housing demand has stayed broadly intact despite elevated interest rates and restrictive monetary conditions. However, the recent rebound in inflation and producer price pressures suggests that progress toward price stability may be stalling, increasing the likelihood that inflation remains above central bank targets for longer than markets currently expect. Consequently, policymakers are likely to maintain a cautious approach toward policy easing, keeping interest rates restrictive until there is clearer evidence that inflation is returning sustainably toward target levels.
Outlook: Strong AI-Led Earnings Face Rising Tests from Inflation, Energy, and Geopolitics
Strong earnings momentum continues to provide the most robust foundation for equities, but macro risks are becoming increasingly difficult to ignore. May’s rally was broad-based and supported by genuine earnings delivery, with earnings beat rates reaching their highest levels in five years. The earnings backdrop remains the clearest justification for maintaining constructive positioning, particularly within the AI ecosystem around US$700 billion of CapEx continue to support a multi-year investment cycle across semiconductors, infrastructure, and digital supply chains. The strong performances of the SK and Japan further demonstrate how aggressively markets are repricing AI supply-chain beneficiaries. However, the key challenge for investors is determining how long earnings momentum can continue to offset the growing headwinds from reaccelerating inflation, a potentially more hawkish Federal Reserve, and heightened geopolitical uncertainty.
Geopolitics has evolved from a tail risk into the dominant macro-variable shaping market outcomes. Energy prices are projected to rise 24% in 2026 following what could become the largest oil supply shock on record, increasing the risk that higher input costs are passed through to consumers and further entrench inflationary pressures. This comes at a time when inflation is already showing signs of broadening, adding to concerns that the Fed may need to maintain restrictive policy settings for longer. The appointment of new Fed Chair Kevin Warsh further reinforces this risk, given his historical emphasis on price stability and hawkish stance toward inflation. Meanwhile, the uncertain duration of the Middle East conflict continues to cloud the outlook. A swift de-escalation would provide a meaningful positive catalyst for risk assets, while a prolonged disruption could keep inflation structurally elevated and undermine the earnings-driven bull case.
The bull case remains intact, but it is narrower and more fragile than recent market performance may suggest. AI infrastructure beneficiaries continue to offer the highest-conviction opportunities given their strong earnings visibility and exposure to powerful secular growth trends. However, valuation discipline remains critical following significant re-ratings across key beneficiaries. At the broader market level, several risks remain underappreciated, including increasingly concentrated earnings growth, historically weak consumer sentiment, a bond market offering more competitive risk-adjusted returns, and a new Fed that may be less willing to support richly valued asset prices at the first signs of weakness. In addition, Energy’s decline during May appears more reflective of profit-taking than a resolution of underlying supply risks. As such, maintaining duration caution and preserving portfolio flexibility remain prudent, particularly as an upside surprise in May’s inflation data could trigger a sharp repricing of rate expectations and renewed market volatility.
FIXED INCOME UPDATE
 Source: Bloomberg; Returns are presented in USD terms
Source: Bloomberg; Returns are presented in USD terms
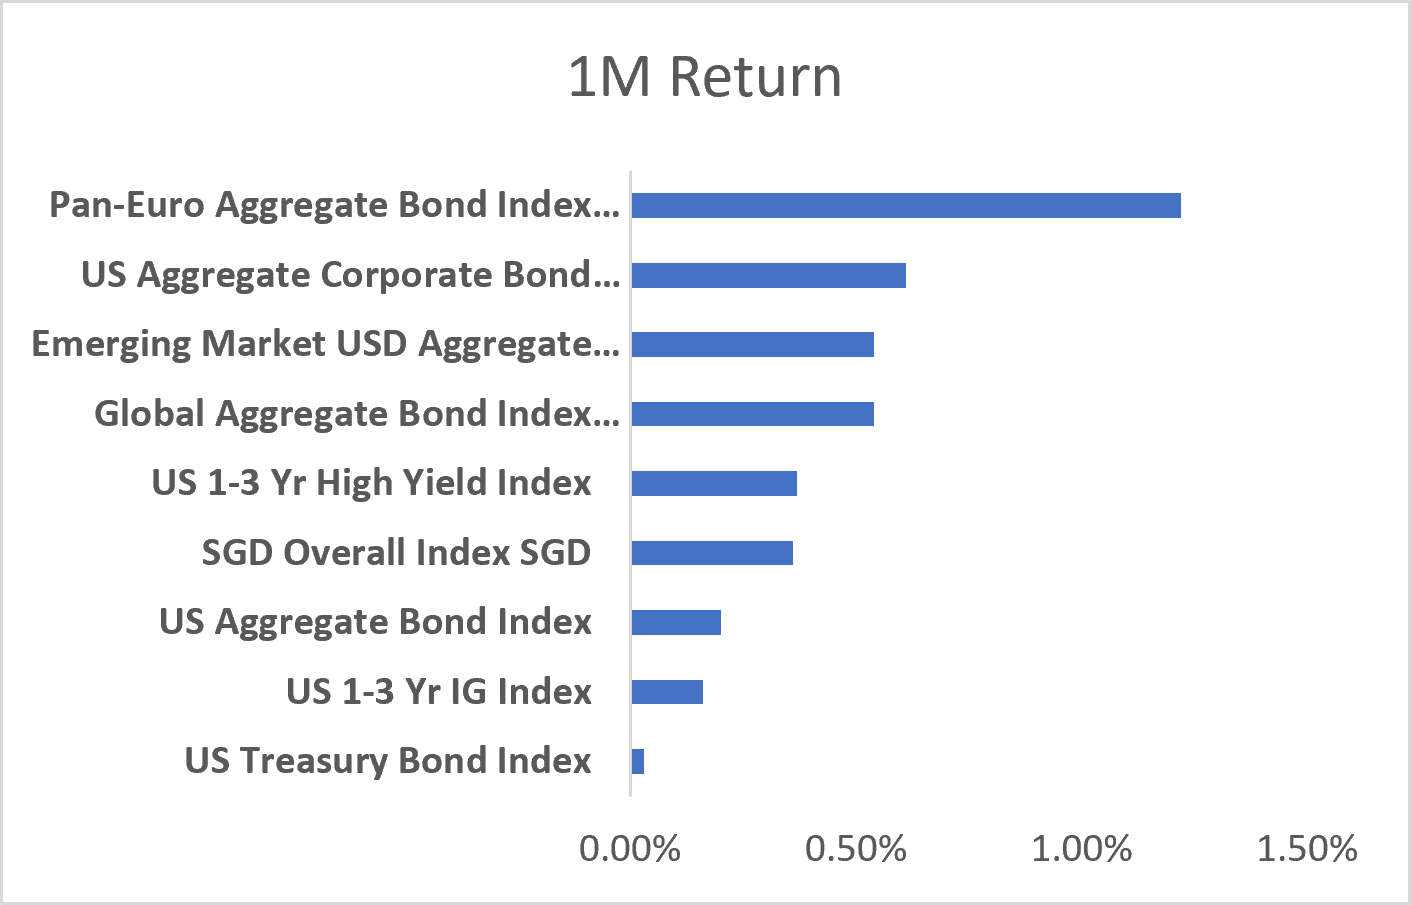
Global bonds endured a volatile May as the Iran war kept energy markets unsettled and investors repriced inflation risks. The Pan‑Euro Aggregate Index led the one‑month table with a return of about +1.2%, marking Europe as the top performer for the month. That shift was notable given Europe has often been a laggard in recent periods, and its emergence as the monthly leader caught our attention. The next strongest performers were the Emerging Market USD Aggregate and the US Aggregate Corporate Bond Index, both supported by resilient demand and attractive carry. At the other end of the spectrum, the US Treasury Index lagged, eking out only a modest advance. Treasuries bore the brunt of May’s repricing, with yields rising sharply on sticky inflation expectations and delayed Fed cut prospects, leaving them the weakest segment globally on the month and YTD.
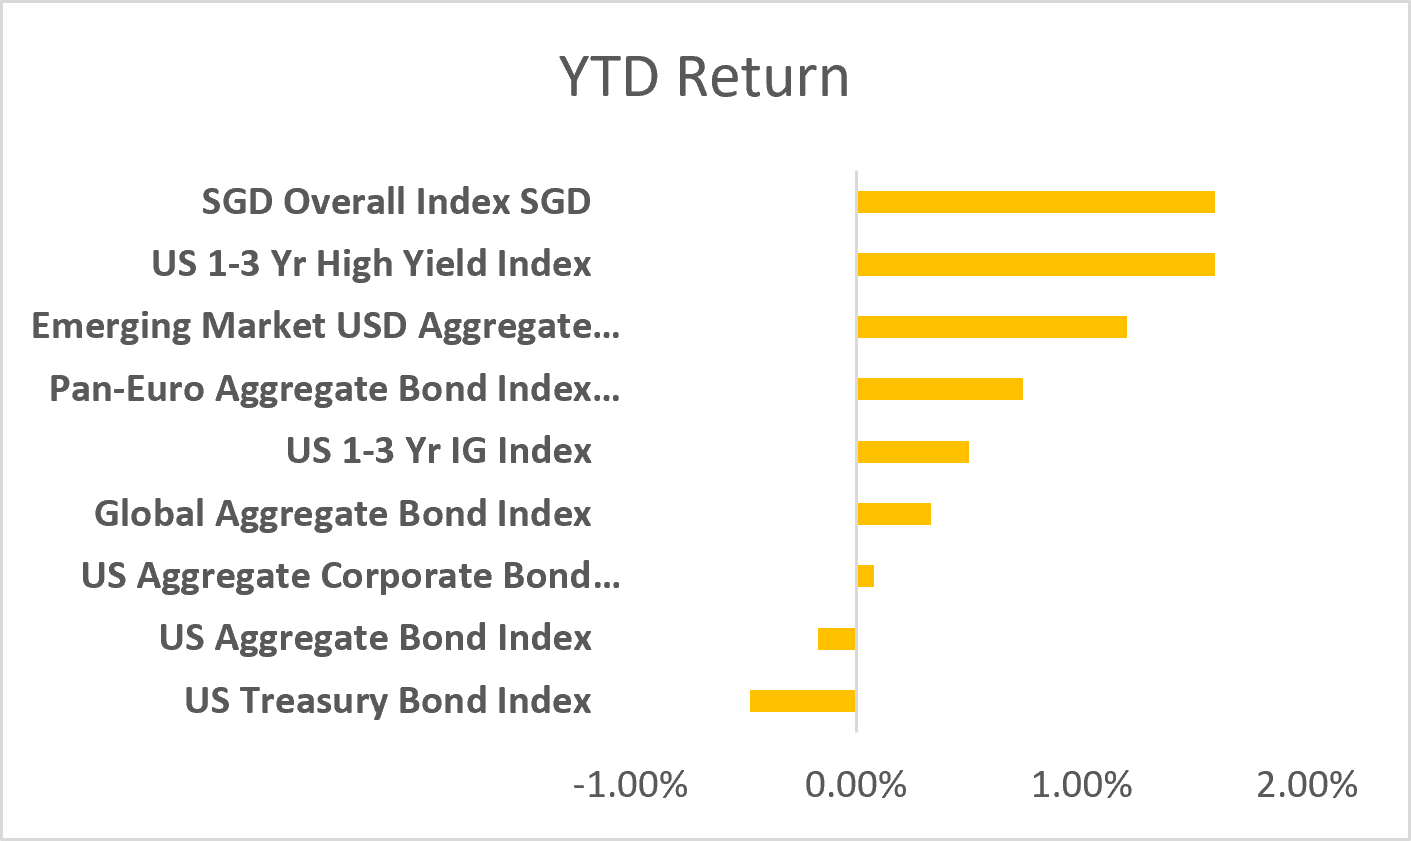
Year‑to‑date, the SGD Overall Index remains the leader with a return of 1.6%, underscoring Singapore’s credit strength and currency stability. Emerging Markets also remain among the stronger performers, while short‑duration benchmarks such as the US 1–3 Year High Yield and US 1–3 Year IG indices have held up well, showcasing their ability to absorb rate volatility and provide steadier returns in a higher yield environment.
European Bonds Step Into the Spotlight
Europe’s emergence as the monthly leader was striking, given its usual position as a laggard. That shift caught our eye, and the explanation lies in the relative yield dynamics between the US and euro‑area markets. May was described by Reuters as a “wild ride” for global bonds: US yields surged on sticky inflation and heavy fiscal issuance, while euro‑area yields slipped modestly, cushioned by weak activity. The eurozone economy contracted at its sharpest pace in over two years, and as Candriam CIO Nicolas Forest observed, “with this level of yields it’s becoming attractive for an investor… we have a slowdown of the economy and that’s supportive for the bond markets.”
This divergence highlights how relative moves, not absolute ones, can sometimes influence the performance between different segments of the bond market. Europe’s outperformance was not a fundamental turnaround but rather a reflection of weaker growth making bonds relatively more appealing compared to US Treasuries. Investors rotated into European debt as a hedge against US duration risk, while Treasuries bore the brunt of repricing. The US Treasury Index ended May as the weakest globally, both on the month and YTD, underscoring how inflation persistence and fiscal supply pressures continue to weigh on long‑duration US assets.
Another layer came from the Fed transition. Warsh’s debut as chair introduced uncertainty into communication, with markets testing how his tone differs from Powell’s on inflation persistence and fiscal sustainability. That uncertainty amplified the US yield rise, widening the gap with Europe. Fiscal deficits remain a structural overhang, and the sheer scale of issuance keeps Treasuries vulnerable even when growth data softens. In contrast, Europe’s slowdown paradoxically lent support to its bonds, reinforcing the divergence.
The war premium from the Iran conflict kept energy markets volatile, feeding inflation expectations unevenly across regions. US markets priced in more of this risk, while Europe’s weaker activity muted the impact. In Asia, policy steadiness provided a counterpoint: MAS maintained its consistent stance, anchoring SGD credit and reinforcing Singapore’s position as the YTD leader. Taken together, May was defined by divergence – US yields rising faster, Europe finding relative support, and Asia offering stability.
Important Information
This material is provided by Phillip Capital Management (S) Ltd (“PCM”) for general information only and does not constitute a recommendation, an offer to sell, or a solicitation of any offer to invest in any of the exchange-traded fund (“ETF”) or the unit trust (“Products”) mentioned herein. It does not have any regard to your specific investment objectives, financial situation and any of your particular needs. You should read the Prospectus and the accompanying Product Highlights Sheet (“PHS”) for key features, key risks and other important information of the Products and obtain advice from a financial adviser (“FA“) before making a commitment to invest in the Products. In the event that you choose not to obtain advice from a FA, you should assess whether the Products are suitable for you before proceeding to invest. A copy of the Prospectus and PHS are available from PCM, any of its Participating Dealers (“PDs“) for the ETF, or any of its authorised distributors for the unit trust managed by PCM.
An ETF is not like a typical unit trust as the units of the ETF (the “Units“) are to be listed and traded like any share on the Singapore Exchange Securities Trading Limited (“SGX-ST”). Listing on the SGX-ST does not guarantee a liquid market for the Units which may be traded at prices above or below its NAV or may be suspended or delisted. Investors may buy or sell the Units on SGX-ST when it is listed. Investors cannot create or redeem Units directly with PCM and have no rights to request PCM to redeem or purchase their Units. Creation and redemption of Units are through PDs if investors are clients of the PDs, who have no obligation to agree to create or redeem Units on behalf of any investor and may impose terms and conditions in connection with such creation or redemption orders. Please refer to the Prospectus of the ETF for more details.
Investments are subject to investment risks including the possible loss of the principal amount invested, and are not obligations of, deposits in, guaranteed or insured by PCM or any of its subsidiaries, associates, affiliates or PDs. The value of the units and the income accruing to the units may fall or rise. Past performance is not necessarily indicative of the future or likely performance of the Products. There can be no assurance that investment objectives will be achieved. Any use of financial derivative instruments will be for hedging and/or for efficient portfolio management. PCM reserves the discretion to determine if currency exposure should be hedged actively, passively or not at all, in the best interest of the Products. The regular dividend distributions, out of either income and/or capital, are not guaranteed and subject to PCM’s discretion. Past payout yields and payments do not represent future payout yields and payments. Such dividend distributions will reduce the available capital for reinvestment and may result in an immediate decrease in the net asset value (“NAV”) of the Products. Please refer to <www.phillipfunds.com> for more information in relation to the dividend distributions.
The information provided herein may be obtained or compiled from public and/or third party sources that PCM has no reason to believe are unreliable. Any opinion or view herein is an expression of belief of the individual author or the indicated source (as applicable) only. PCM makes no representation or warranty that such information is accurate, complete, verified or should be relied upon as such. The information does not constitute, and should not be used as a substitute for tax, legal or investment advice.
The information herein are not for any person in any jurisdiction or country where such distribution or availability for use would contravene any applicable law or regulation or would subject PCM to any registration or licensing requirement in such jurisdiction or country. The Products is not offered to U.S. Persons. PhillipCapital Group of Companies, including PCM, their affiliates and/or their officers, directors and/or employees may own or have positions in the Products. This advertisement has not been reviewed by the Monetary Authority of Singapore.