
Weekly Commentary: 19 September 2022 – 25 September 2022

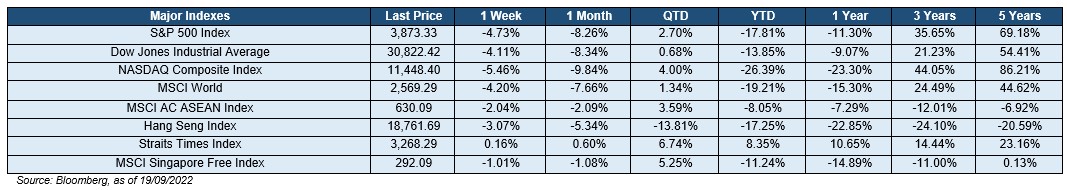
The stock market dipped last week as a reaction to the August U.S. inflation data that was released on Tuesday. The U.S. CPI or headline inflation slowed to 8.3% YoY, from July’s 8.5% YoY. However, the CPI index rose 0.1% MoM while the core inflation rate also accelerated to 6.3% YoY, from 5.9% the prior month. As a result, growth stocks as loosely represented by the NASDAQ Composite (-5.46%) fared worst, followed by the S&P 500 (-4.73%) and the Dow Jones Industrial Average (-4.11%). Other key market indices including the Hang Seng (-3.07%) were mostly in the negative with the exception of the STI (+0.16%). All eleven S&P 500 sectors reported negative returns with the defensives such as Healthcare (-2.32%) and Consumer Staples (-3.48%), in addition to Energy (-2.59%) holding up the best. In contrast, Materials (-6.64%), Industrials (-6.37%), and other growth sectors such as Communication Services (-6.42%) and InfoTech (-6.11%) were the worst hit.
Market focus is now on the upcoming 24th September FOMC meeting, with most expecting the next hike to be between 75 to 100 bps given the persisting inflation. The Fed’s preferred inflation gauge – U.S. Personal Consumption Expenditure (PCE), seemed to have previously peaked as well where both the headline and core PCE decelerated by 0.5 pp to 6.30% YoY and by 0.4 pp to 4.60% YoY in July respectively. Nevertheless, rising energy prices remained a concern as it is the primary driving force behind the elevated inflation level. Singapore’s CPI in July has accelerated by 0.3 pp MoM to 7% YoY, the highest since the GFC, while MAS core inflation also moved up by 0.4 pp to 4.8% YoY. Nearly four dozen countries have raised interest rates in the past six months as central banks hope to contain it, but the level is also likely to remain high in the second half of 2022 due to lack of resolutions to the current energy supply constraints.
The yield-curve continued to be inverted as the 10Y-2Y US Treasury fell by 19 bps to reach -0.42% last week. Both the U.S 2-year and 10-year treasury yield increased by 48 bps to 3.87% and by 26 bps to 3.45% respectively. The overall stock market sentiment turned risk-off with a sharp jump in volatility as the global High Yield (HY) – Investment Grade (IG) spread widened by 37 bps to 3.45% and the CBOE Volatility Index (VIX) surged 351 bps to 26.30%.
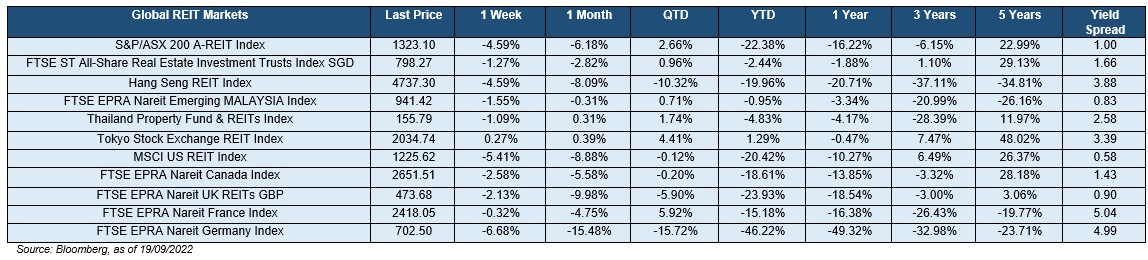
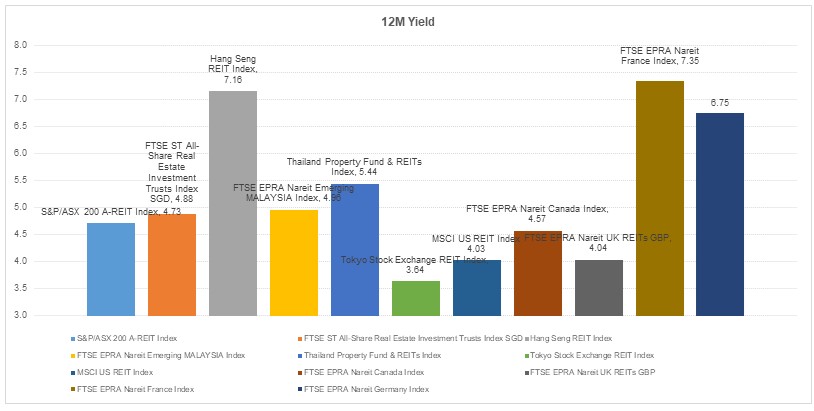
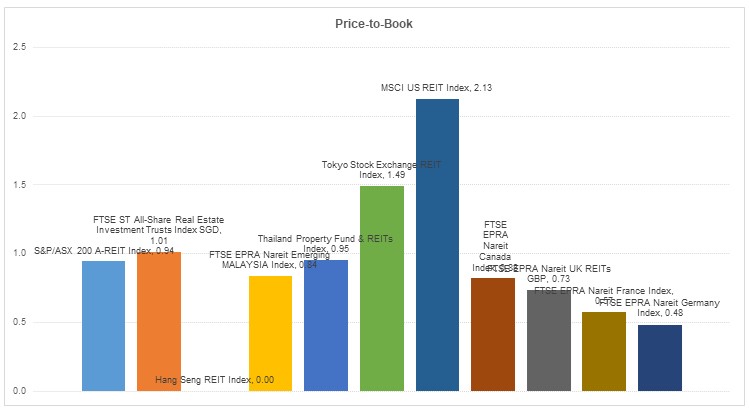
As can be seen below, most of the global REIT markets were in the negative with the exception of Japan. However, the overall 12-month yield spreads also remained positive and favorable towards forward total returns. Back at home, the iEdge S-REIT Index (-1.21%) and all of its subsectors also reported negative returns with the exception of Diversified (+0.69%). Retail (-1.26%) also relatively held up better as well. In the other hand, Hospitality (-4.90%) and Healthcare (-2.04%) underperformed. With regards to the pandemic, the 7-day moving average of total COVID-19 cases stayed elevated, but continued to hover around two thousand cases for the past two weeks.
Important Information
This material is provided by Phillip Capital Management (S) Ltd (“PCM”) for general information only and does not constitute a recommendation, an offer to sell, or a solicitation of any offer to invest in any of the exchange-traded fund (“ETF”) or the unit trust (“Products”) mentioned herein. It does not have any regard to your specific investment objectives, financial situation and any of your particular needs. You should read the Prospectus and the accompanying Product Highlights Sheet (“PHS”) for key features, key risks and other important information of the Products and obtain advice from a financial adviser (“FA“) before making a commitment to invest in the Products. In the event that you choose not to obtain advice from a FA, you should assess whether the Products are suitable for you before proceeding to invest. A copy of the Prospectus and PHS are available from PCM, any of its Participating Dealers (“PDs“) for the ETF, or any of its authorised distributors for the unit trust managed by PCM.
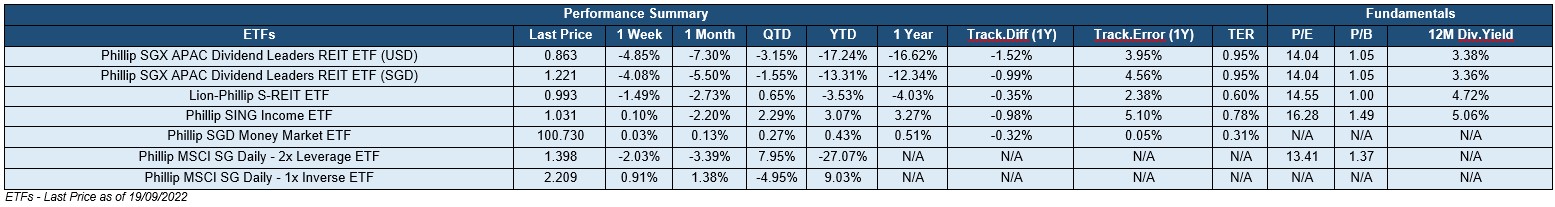
An ETF is not like a typical unit trust as the units of the ETF (the “Units“) are to be listed and traded like any share on the Singapore Exchange Securities Trading Limited (“SGX-ST”). Listing on the SGX-ST does not guarantee a liquid market for the Units which may be traded at prices above or below its NAV or may be suspended or delisted. Investors may buy or sell the Units on SGX-ST when it is listed. Investors cannot create or redeem Units directly with PCM and have no rights to request PCM to redeem or purchase their Units. Creation and redemption of Units are through PDs if investors are clients of the PDs, who have no obligation to agree to create or redeem Units on behalf of any investor and may impose terms and conditions in connection with such creation or redemption orders. Please refer to the Prospectus of the ETF for more details.
Investments are subject to investment risks including the possible loss of the principal amount invested, and are not obligations of, deposits in, guaranteed or insured by PCM or any of its subsidiaries, associates, affiliates or PDs. The value of the units and the income accruing to the units may fall or rise. Past performance is not necessarily indicative of the future or likely performance of the Products. There can be no assurance that investment objectives will be achieved. Any use of financial derivative instruments will be for hedging and/or for efficient portfolio management. PCM reserves the discretion to determine if currency exposure should be hedged actively, passively or not at all, in the best interest of the Products. The regular dividend distributions, out of either income and/or capital, are not guaranteed and subject to PCM’s discretion. Past payout yields and payments do not represent future payout yields and payments. Such dividend distributions will reduce the available capital for reinvestment and may result in an immediate decrease in the net asset value (“NAV”) of the Products. Please refer to <www.phillipfunds.com> for more information in relation to the dividend distributions.
The information provided herein may be obtained or compiled from public and/or third party sources that PCM has no reason to believe are unreliable. Any opinion or view herein is an expression of belief of the individual author or the indicated source (as applicable) only. PCM makes no representation or warranty that such information is accurate, complete, verified or should be relied upon as such. The information does not constitute, and should not be used as a substitute for tax, legal or investment advice.
The information herein are not for any person in any jurisdiction or country where such distribution or availability for use would contravene any applicable law or regulation or would subject PCM to any registration or licensing requirement in such jurisdiction or country. The Products is not offered to U.S. Persons. PhillipCapital Group of Companies, including PCM, their affiliates and/or their officers, directors and/or employees may own or have positions in the Products. This advertisement has not been reviewed by the Monetary Authority of Singapore.