
Weekly Commentary: 11 Sep 2023 – 17 Sep 2023
 Returns were negative last week across the various indexes. The losses were due to stock market heavyweight Apple enduring a two-day sell off that wiped almost $200 billion from its market cap following reports that the Chinese government extends its iPhone ban to more workers as tensions with US rise. Fed Officials’ rates stance seems to be shifting towards pausing raising interest rate. Recent data shows easing inflation and a less overheated labour market, and these variables gives confidence that inflation is not going to be persistent. There seem to be underlying inflation pressure such as last Thursday’s weekly jobless claims report that came in lower than expected. It fell to 216,000, the lowest level in six months.
Canada has held their benchmark rate steady at 5% after back-to-back increases in June and July. Its economy has contracted 0.2 annualised, on a sharp slowdown in consumer spending and a fifth straight quarterly decline in housing investment. Canada’s unemployment rate seems worrying as it rose again by a half percentage point in the span of three months, and now sits at 5.5%, and job vacancies have dropped 25% from their peak last year and sit at their lowest level in more than 2 years.
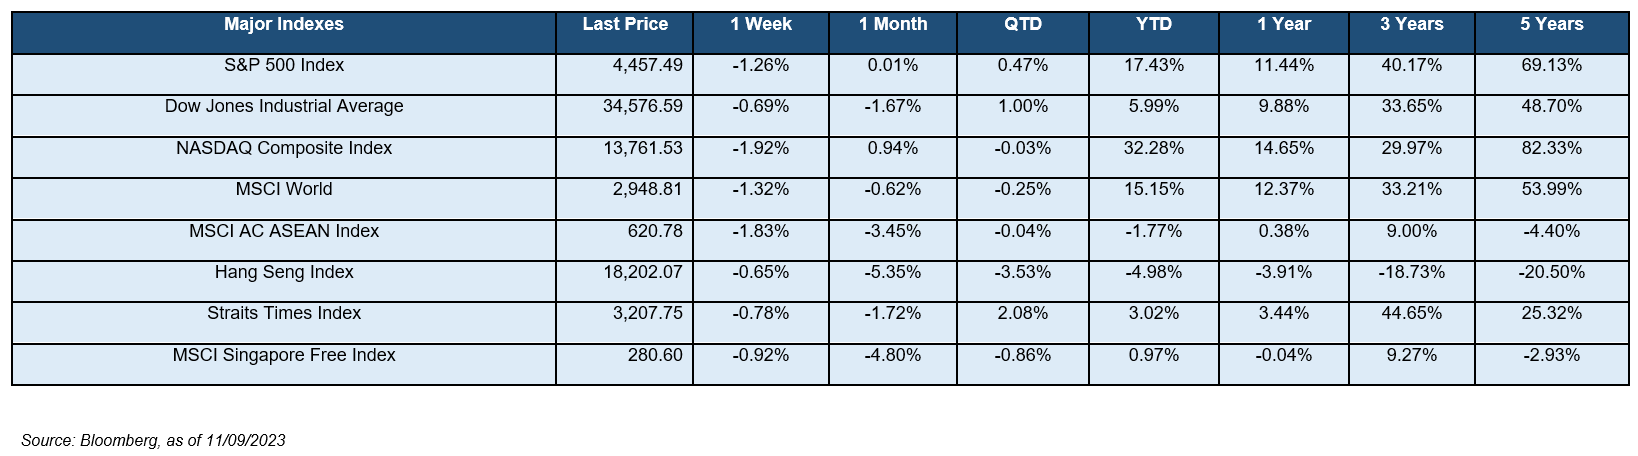
Stock returns were negative over the week as observed across the following 3 indices, with the Dow Jones Industrial Average (-0.69%), S&P 500 Index (-1.26%), NASDAQ Composite Index (-1.92%). Other notable key market indices that generated negative returns consist of MSCI World (-1.32%) & Hang Seng Index (-0054%). All S&P 500 sectors registered negative returns last week with notable sectors – Information Technology (-2.34%), Industrials (-2.88%) and Materials (-2.38%) falling more than the rest of the sector. For 2022, index returns were negative for the Dow Jones Industrial Average (-8.78%), S&P 500 (-19.44%) and the NASDAQ Composite (-33.10%).
The yield-curve remains inverted as the 10Y-2Y US Treasury spread tightened to -0.69%. driven by U.S 2-year and 10-year Treasury yields rising 22 bps to 4.99% and rising 27 bps to 4.30% respectively. Market sentiment also became more risk-on as the U.S. High Yield (HY) – Investment Grade (IG) credit spread tightened 19 bps to 2.53% while the CBOE Volatility Index (VIX) has fallen 294 bps to 14.16%.
This coming week, The ECB will be making their interest rate decision. Apple will be hosting their latest product event and all eyes will be on the Iphone 15 and it was initially poised to unseat Samsung as the world’s largest handset maker.
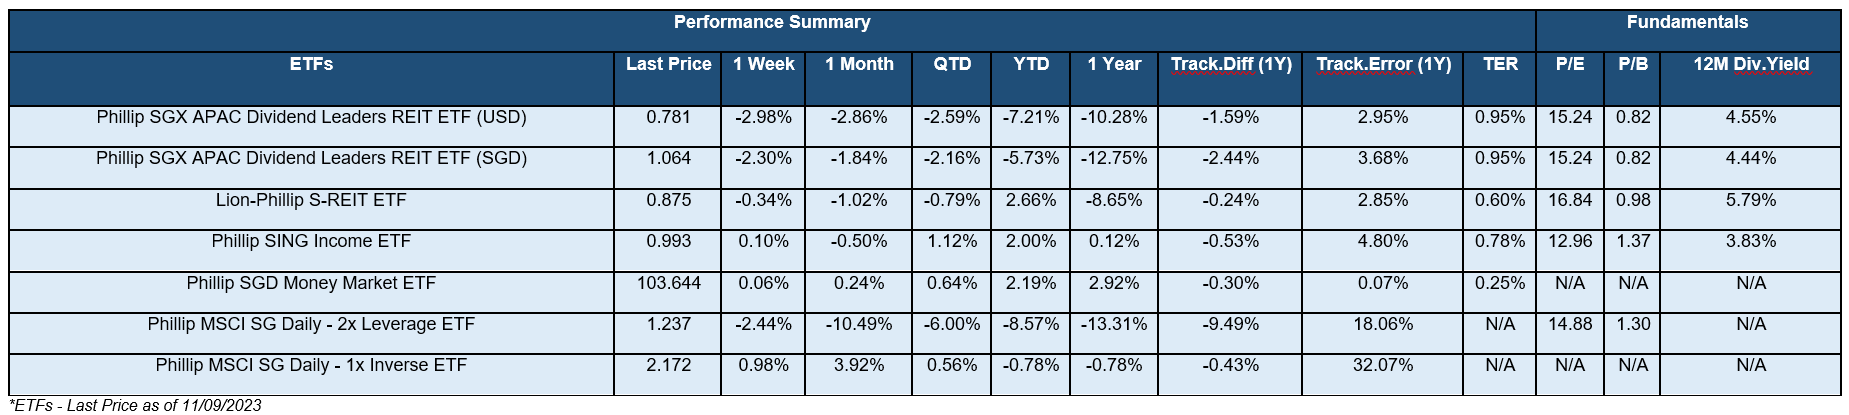
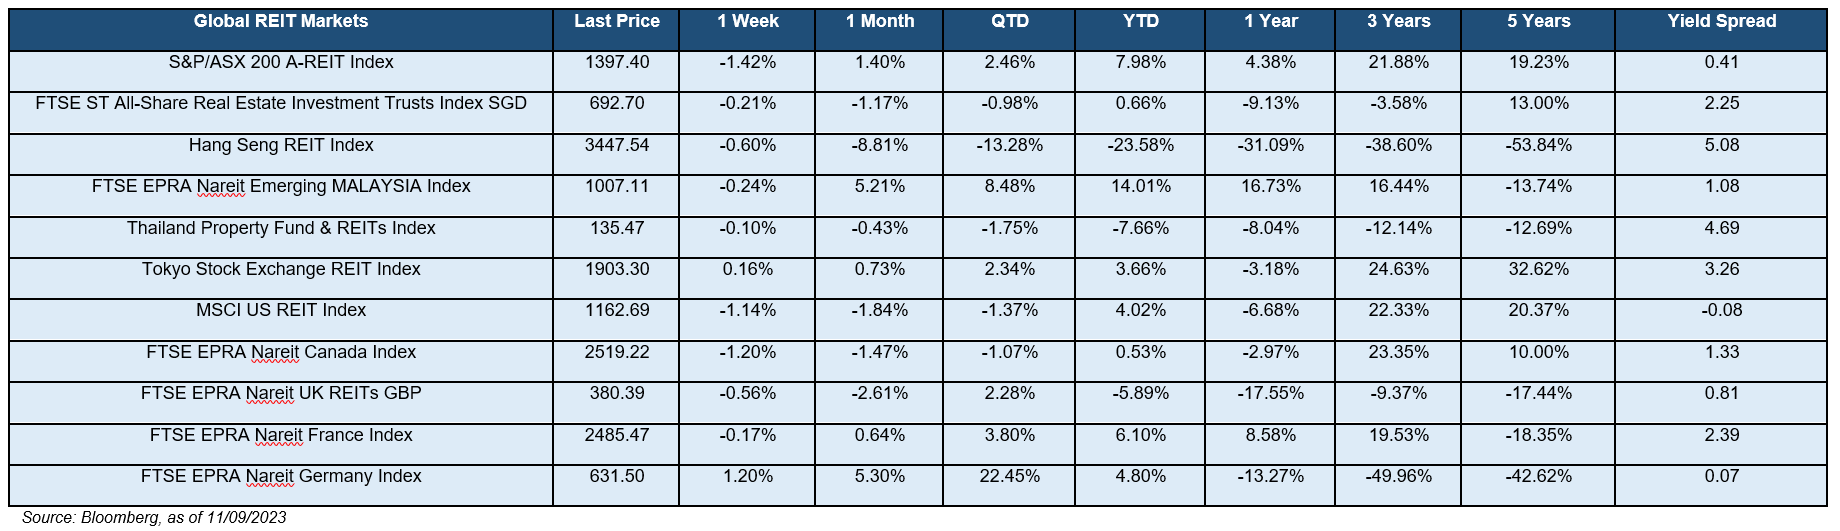
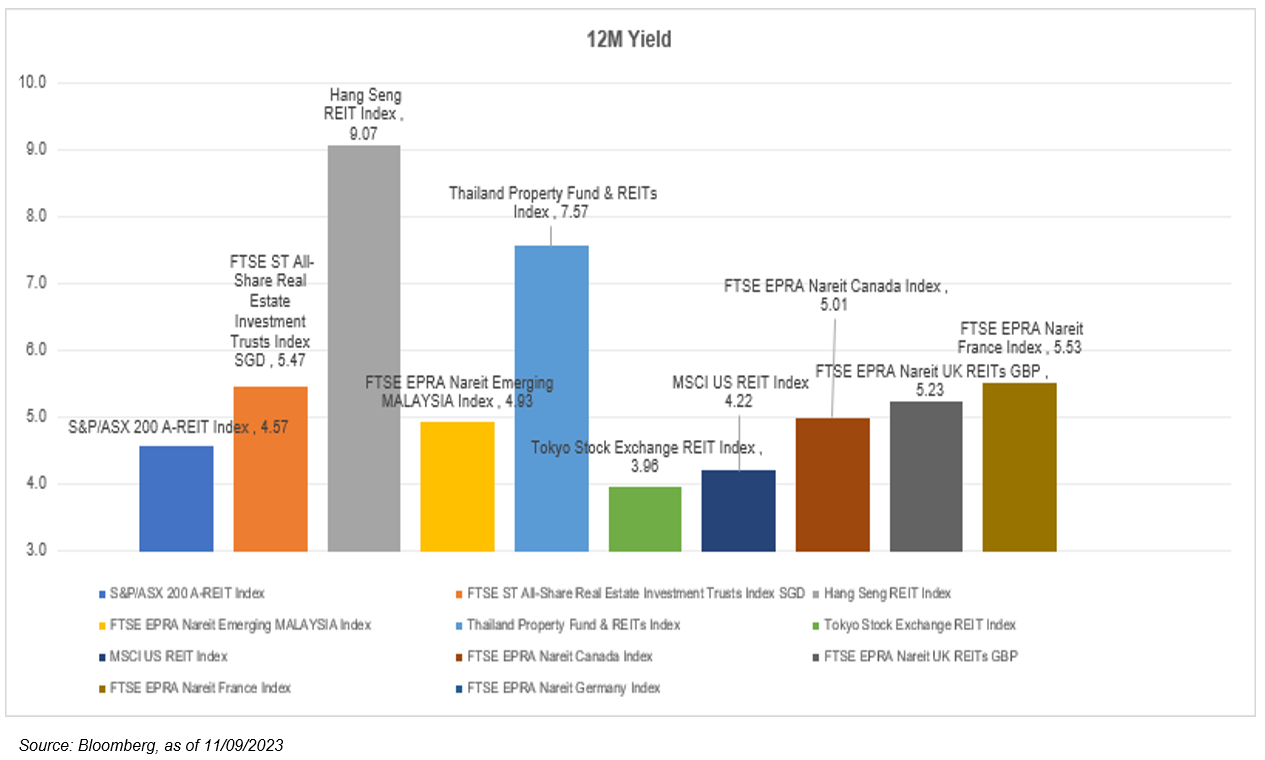
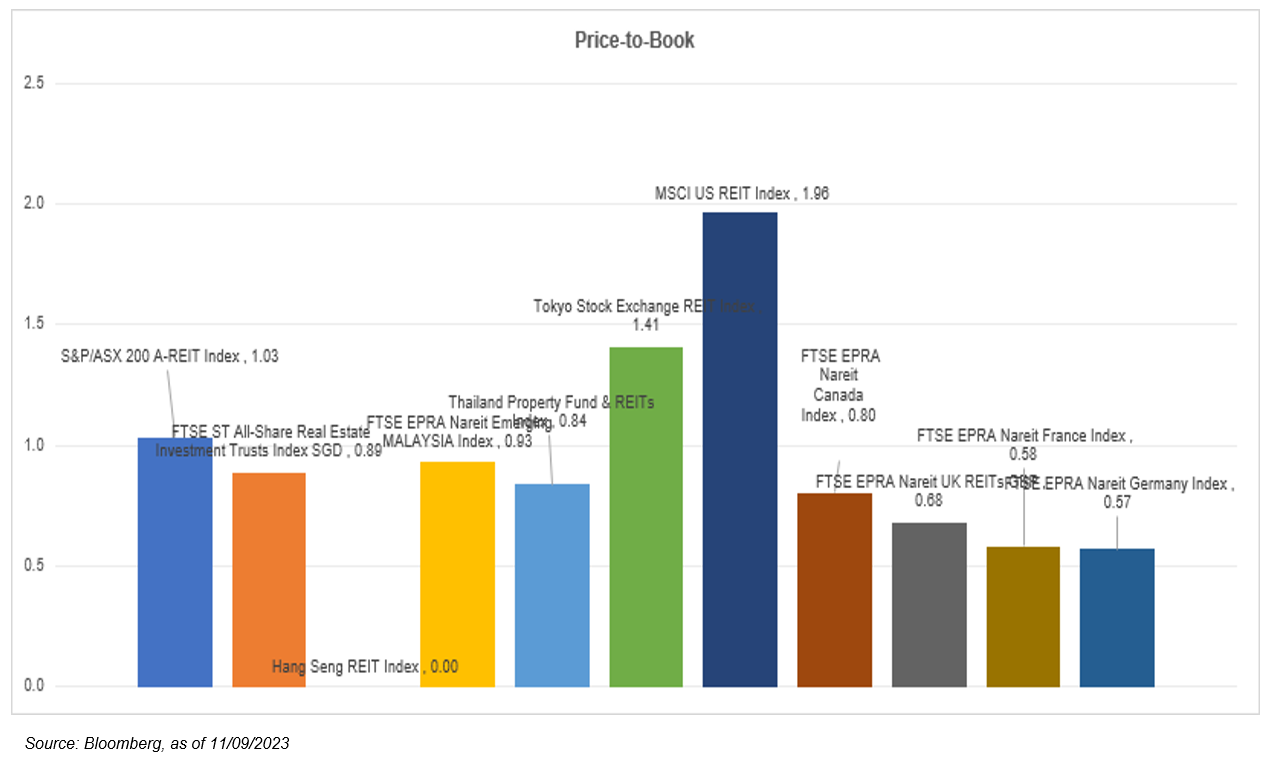
 The global REITs market’s return were mostly in the mixed across the numerous benchmarks. Thailand Property Fund & REITs Index (-0.10%), Hang Seng REIT Index (-0.60%) and FTSE EPRA Nareit UK REITs GBP (-0.56%) the notable REITs that generated negative returns over the past week. Closer to home, the iEdge S-REIT Index (-0.17%) and most of its subsectors generated mixed weekly returns with Hotel and Resort REITS (+1.91%) and Real Estate Operating Companies REITs (+0.86%), the notable sector that outperformed the rest last week. REITs generally have been affected by decreasing yield spread as interest rates surged and investors price in the possibility of reduced distributions stemming from higher financing costs. However, we do expect inflows to return to the sector given the existing attractive valuations on offer and resilience offered by the REIT asset class in light of the waning global growth outlook.
Important Information
This material is provided by Phillip Capital Management (S) Ltd (“PCM”) for general information only and does not constitute a recommendation, an offer to sell, or a solicitation of any offer to invest in any of the exchange-traded fund (“ETF”) or the unit trust (“Products”) mentioned herein. It does not have any regard to your specific investment objectives, financial situation and any of your particular needs. You should read the Prospectus and the accompanying Product Highlights Sheet (“PHS”) for key features, key risks and other important information of the Products and obtain advice from a financial adviser (“FA“) before making a commitment to invest in the Products. In the event that you choose not to obtain advice from a FA, you should assess whether the Products are suitable for you before proceeding to invest. A copy of the Prospectus and PHS are available from PCM, any of its Participating Dealers (“PDs“) for the ETF, or any of its authorised distributors for the unit trust managed by PCM.
An ETF is not like a typical unit trust as the units of the ETF (the “Units“) are to be listed and traded like any share on the Singapore Exchange Securities Trading Limited (“SGX-ST”). Listing on the SGX-ST does not guarantee a liquid market for the Units which may be traded at prices above or below its NAV or may be suspended or delisted. Investors may buy or sell the Units on SGX-ST when it is listed. Investors cannot create or redeem Units directly with PCM and have no rights to request PCM to redeem or purchase their Units. Creation and redemption of Units are through PDs if investors are clients of the PDs, who have no obligation to agree to create or redeem Units on behalf of any investor and may impose terms and conditions in connection with such creation or redemption orders. Please refer to the Prospectus of the ETF for more details.
Investments are subject to investment risks including the possible loss of the principal amount invested, and are not obligations of, deposits in, guaranteed or insured by PCM or any of its subsidiaries, associates, affiliates or PDs. The value of the units and the income accruing to the units may fall or rise. Past performance is not necessarily indicative of the future or likely performance of the Products. There can be no assurance that investment objectives will be achieved. Any use of financial derivative instruments will be for hedging and/or for efficient portfolio management. PCM reserves the discretion to determine if currency exposure should be hedged actively, passively or not at all, in the best interest of the Products. The regular dividend distributions, out of either income and/or capital, are not guaranteed and subject to PCM’s discretion. Past payout yields and payments do not represent future payout yields and payments. Such dividend distributions will reduce the available capital for reinvestment and may result in an immediate decrease in the net asset value (“NAV”) of the Products. Please refer to <www.phillipfunds.com> for more information in relation to the dividend distributions.
The information provided herein may be obtained or compiled from public and/or third party sources that PCM has no reason to believe are unreliable. Any opinion or view herein is an expression of belief of the individual author or the indicated source (as applicable) only. PCM makes no representation or warranty that such information is accurate, complete, verified or should be relied upon as such. The information does not constitute, and should not be used as a substitute for tax, legal or investment advice.
The information herein are not for any person in any jurisdiction or country where such distribution or availability for use would contravene any applicable law or regulation or would subject PCM to any registration or licensing requirement in such jurisdiction or country. The Products is not offered to U.S. Persons. PhillipCapital Group of Companies, including PCM, their affiliates and/or their officers, directors and/or employees may own or have positions in the Products. This advertisement has not been reviewed by the Monetary Authority of Singapore.