
Weekly Commentary: 30 Oct 2023 – 5 Nov 2023

Major US equity benchmarks were negative for the past week. The US economy grew 4.9% in Q3 2023, the most since Q4 in 2021, above market expectations of 4.3% and 2.1% growth in Q2. Consumer spending remained strong as they rose 4%, up from just 0.8% in Q2. Still, rates are widely expected to hold steady at a 22-year high as the policymakers would likely need more time to assess the effect of their previous rate increases and the recent sharp sell-off in bond markets.
The ECB followed the Federal Reserve’s footsteps as they held interest rates steady, ending a historic run of 10 consecutive rate increases. The eurozone economy has been weakening as declining manufacturing output spills over to other sectors of the economy. Inflation across the eurozone has also declined to 4.3% in September from a peak of more than 10% last year. In spite of the weakness of the economy across the eurozone, the banks are getting a boost with the rise of interest. Deutsche Bank forecasted its highest annual revenues for 8 years, Santander reported an increase in net profit of 20%, and Lloyds – often seen as a bellwether for the economy beat forecasts reporting Q2 profit before tax of $ 1.9 billion.
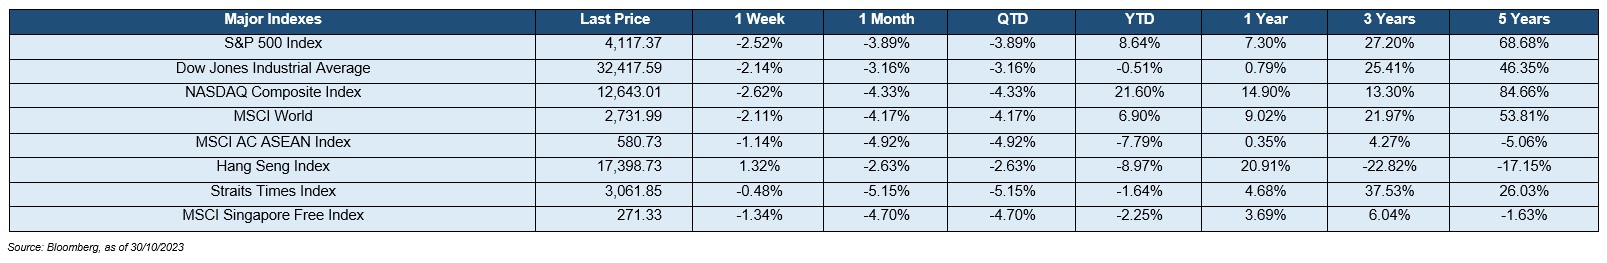
Stock returns were negative over the week as observed across the following 3 indices, with the Dow Jones Industrial Average (-2.14%), S&P 500 Index (-2.52%), and NASDAQ Composite Index (-2.62%). Other notable key market indices that generated negative returns are the MSCI AC ASEAN Index (-1.14%) & MSCI World (-2.11%). All S&P 500 sectors registered negative turns last week with notable sectors – Energy (-6.15%), Communication Services (-6.29%), and Health care (-3.87%) falling more than the rest of the sector. For 2022, index returns were negative for the Dow Jones Industrial Average (-8.78%), S&P 500 (-19.44%), and the NASDAQ Composite (-33.10%).
The yield-curve remains inverted as the 10Y-2Y US Treasury spread remained unchanged for the week at -0.16%. driven by U.S 2-year and 10-year Treasury yields falling 5 bps to 5.02% and falling 5 bps to 4.86% respectively. Market sentiment also became more risk-on as the U.S. High Yield (HY) – Investment Grade (IG) credit spread widened 1 bps to 3.06% while the CBOE Volatility Index (VIX) fell 44 bps to 21.27%.
This coming week, the EU will release Q3 GDP figures and the widely anticipated announcement of the US’s interest rate decision.
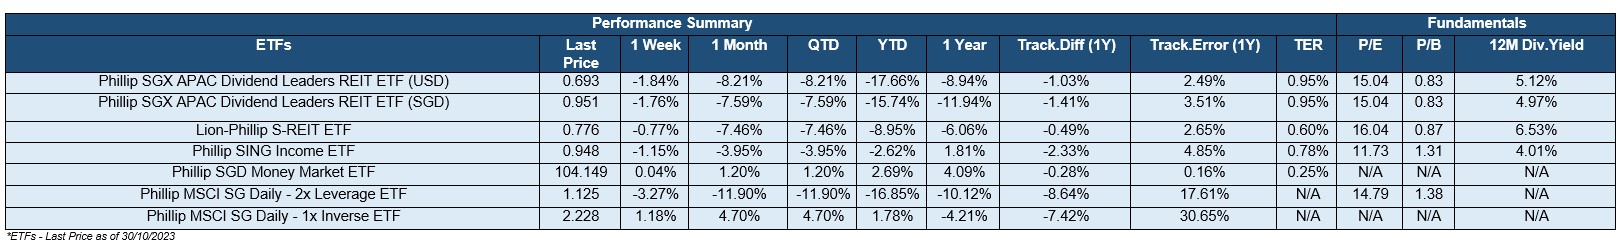
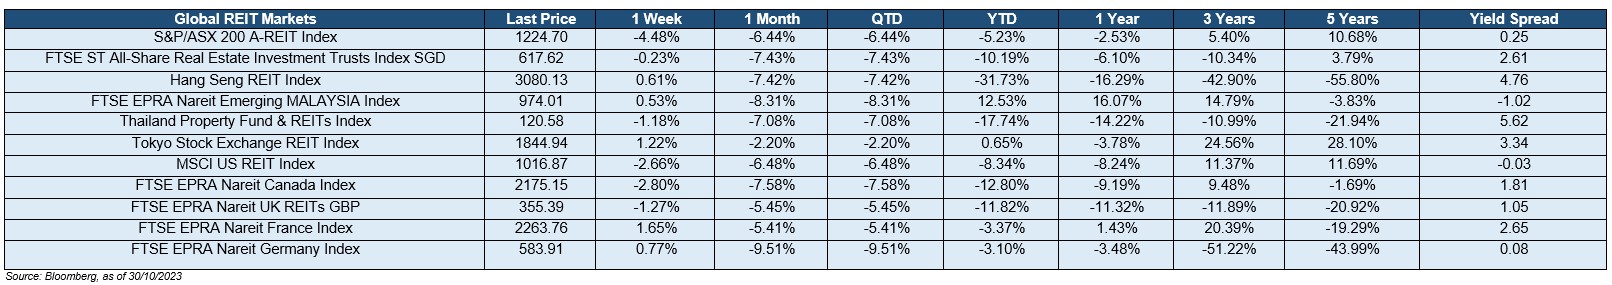
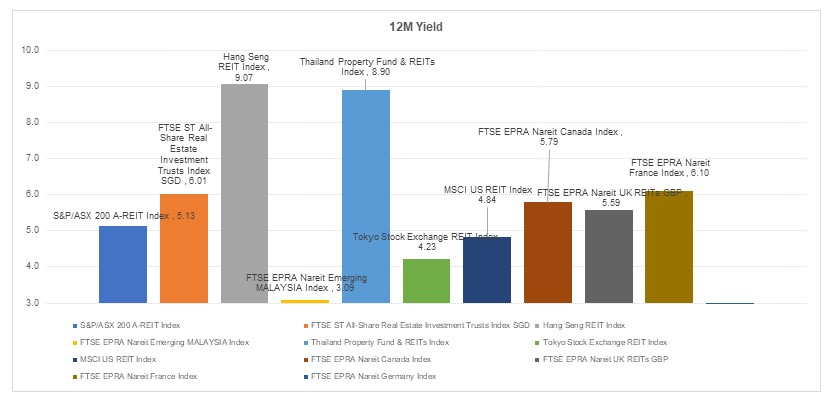
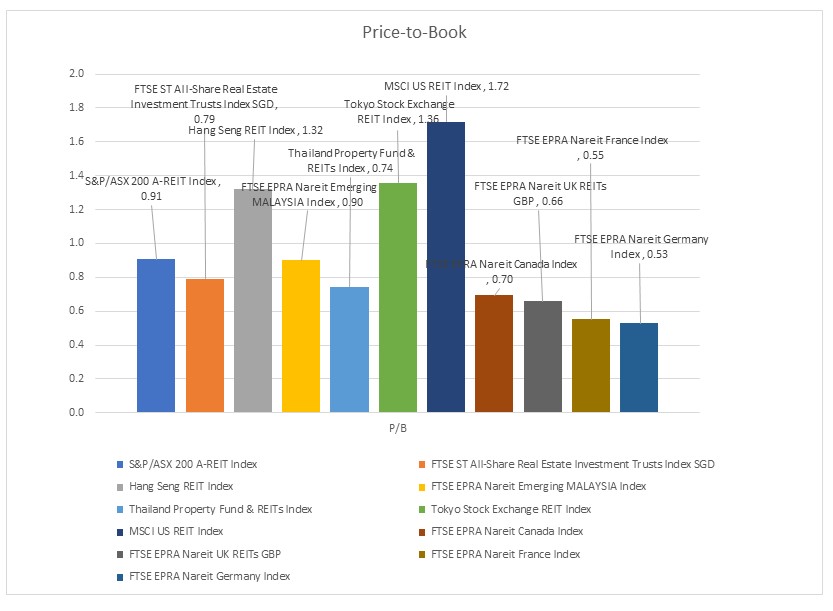
The global REITs market’s returns were mostly in the red across the numerous benchmarks. S&P/ASX 200 A-REIT Index (-4.48%) and FTSE EPRA Nareit Canada Index (-2.80%) are the notable REITs that generated negative returns over the past week. Closer to home, the iEdge S-REIT Index (-0.15%) and all of its subsectors generated negative weekly returns with Real Estate Operating Companies (-4.90%) and Health Care REITs (-4.38%), the notable sector underperformed the rest last week. REITs generally have been affected by decreasing yield spread as interest rates surged and investors price in the possibility of reduced distributions stemming from higher financing costs. However, we do expect inflows to return to the sector given the existing attractive valuations on offer and resilience offered by the REIT asset class in light of the waning global growth outlook.
Important Information
This material is provided by Phillip Capital Management (S) Ltd (“PCM”) for general information only and does not constitute a recommendation, an offer to sell, or a solicitation of any offer to invest in any of the exchange-traded fund (“ETF”) or the unit trust (“Products”) mentioned herein. It does not have any regard to your specific investment objectives, financial situation and any of your particular needs. You should read the Prospectus and the accompanying Product Highlights Sheet (“PHS”) for key features, key risks and other important information of the Products and obtain advice from a financial adviser (“FA“) before making a commitment to invest in the Products. In the event that you choose not to obtain advice from a FA, you should assess whether the Products are suitable for you before proceeding to invest. A copy of the Prospectus and PHS are available from PCM, any of its Participating Dealers (“PDs“) for the ETF, or any of its authorised distributors for the unit trust managed by PCM.
An ETF is not like a typical unit trust as the units of the ETF (the “Units“) are to be listed and traded like any share on the Singapore Exchange Securities Trading Limited (“SGX-ST”). Listing on the SGX-ST does not guarantee a liquid market for the Units which may be traded at prices above or below its NAV or may be suspended or delisted. Investors may buy or sell the Units on SGX-ST when it is listed. Investors cannot create or redeem Units directly with PCM and have no rights to request PCM to redeem or purchase their Units. Creation and redemption of Units are through PDs if investors are clients of the PDs, who have no obligation to agree to create or redeem Units on behalf of any investor and may impose terms and conditions in connection with such creation or redemption orders. Please refer to the Prospectus of the ETF for more details.
Investments are subject to investment risks including the possible loss of the principal amount invested, and are not obligations of, deposits in, guaranteed or insured by PCM or any of its subsidiaries, associates, affiliates or PDs. The value of the units and the income accruing to the units may fall or rise. Past performance is not necessarily indicative of the future or likely performance of the Products. There can be no assurance that investment objectives will be achieved. Any use of financial derivative instruments will be for hedging and/or for efficient portfolio management. PCM reserves the discretion to determine if currency exposure should be hedged actively, passively or not at all, in the best interest of the Products. The regular dividend distributions, out of either income and/or capital, are not guaranteed and subject to PCM’s discretion. Past payout yields and payments do not represent future payout yields and payments. Such dividend distributions will reduce the available capital for reinvestment and may result in an immediate decrease in the net asset value (“NAV”) of the Products. Please refer to <www.phillipfunds.com> for more information in relation to the dividend distributions.
The information provided herein may be obtained or compiled from public and/or third party sources that PCM has no reason to believe are unreliable. Any opinion or view herein is an expression of belief of the individual author or the indicated source (as applicable) only. PCM makes no representation or warranty that such information is accurate, complete, verified or should be relied upon as such. The information does not constitute, and should not be used as a substitute for tax, legal or investment advice.
The information herein are not for any person in any jurisdiction or country where such distribution or availability for use would contravene any applicable law or regulation or would subject PCM to any registration or licensing requirement in such jurisdiction or country. The Products is not offered to U.S. Persons. PhillipCapital Group of Companies, including PCM, their affiliates and/or their officers, directors and/or employees may own or have positions in the Products. This advertisement has not been reviewed by the Monetary Authority of Singapore.