

Market Commentary – April 2026
EQUITY MARKET UPDATE
Source: Bloomberg (Total Return in USD/Local Currency terms)
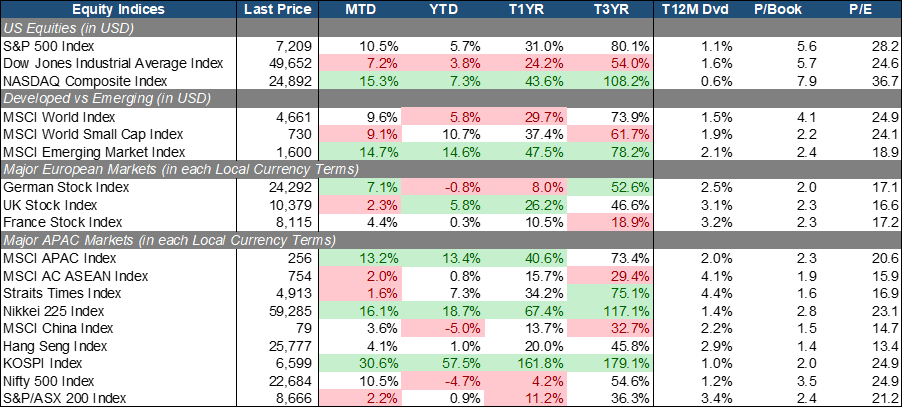
The US equity market has not only recovered from its March lows but has surged, with the S&P 500 (+10.5% MoM) recording its best monthly gains since November 2020. The tech-focused NASDAQ Composite (+15.3% MoM) led the rally, driven by a powerful convergence of strong Q1 earnings and accelerating AI infrastructure commitments from major hyperscalers. While lagging slightly behind Growth, the DJIA (+7.2% MoM) still posted a healthy return, reflecting an overall recovery in market sentiment and broader participation in the advance.
The March sell-off has been replaced by strong, though uneven, gains globally. EM (+14.7% MoM) assets surged in their strongest session in years after a US–Iran ceasefire sent oil prices tumbling and unleashed a wave of global risk appetite, a catalyst that effectively kick-started the April recovery across risk assets. As a result, capital inflows returned and the geopolitical risk premium that had hammered the market segment in Q1 rapidly unwound. Small-Caps (+9.1% MoM) slightly lagged Large-Caps (9.6% MoM), likely reflecting persistent sensitivity to refinancing costs in a “higher-for-longer” rate environment, with rates held steady at 3.50–3.75% and less than a 5% probability of a cut priced in for the June FOMC meeting.
European markets staged a meaningful recovery as energy fears moderated sharply and after President Trump agreed to a two-week ceasefire with Iran, raising hopes that trade through the Strait of Hormuz could soon resume. German equities (+7.1% MoM) were among the primary beneficiaries, given Germany’s industrial base is particularly exposed to energy input costs, with steelmakers and chipmakers leading the domestic advance. The UK (+2.3% MoM) continued to show defensive resilience with its more commodity-heavy composition providing a natural buffer, while France (+4.4% MoM) lagged somewhat, still weighed by lingering domestic political uncertainty despite benefiting from the broader regional relief rally.
The APAC region saw the most dramatic divergence in performance. South Korea’s KOSPI (+30.6% MoM) clocked its best month in 28 years, surging 30.6% to become the global top performer for April, with the index’s outsized gains driven largely by optimism around the AI boom. Index heavyweight SK Hynix was a key engine, surging 9.61% on a single session alone as it tracked the sharp rally in US chip-related equities, reflecting South Korea’s deep structural exposure to the global semiconductor upcycle. Japan (+16.1% MoM) also saw a significant recovery, with its representative index closing above 60,000 for the first time, supported by the global semiconductor boom and improving corporate governance momentum. In the SEA markets, Singapore (+1.6% MoM) remained stable but continued to trail along the ASEAN (+2.0% MoM) benchmark return reflecting the region’s relatively lower direct exposure to the AI and semiconductor themes that dominated the month’s global leadership.
 Source: Bloomberg (Total Return in USD terms)
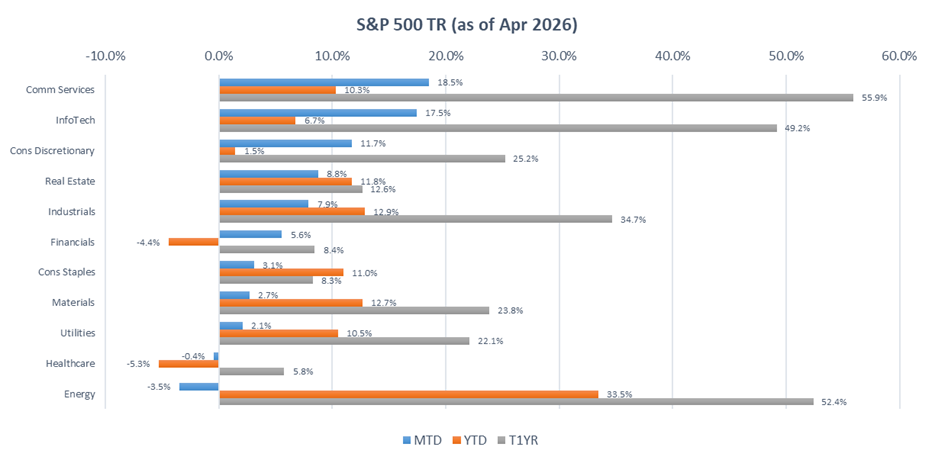
Within S&P 500, Comm Services (+18.5% MoM), Info Tech (+17.5% MoM), and Cons Discretionary (+11.7% MoM) were the standout leaders in April. The rally was unambiguously AI-led where Comm Services and Info Tech delivered Q1 earnings growth of 54.8% and 42.1% respectively, the strongest relatively and directly correlated to the accelerating commercialization of AI. The catalyst was the late-April hyperscalers earnings season, where Microsoft, Alphabet, Meta, and Amazon all reported strong topline Q1 results, with accelerating monetization, cloud backlogs at record levels, and margins holding up alongside revenue growth. Combined 2026 AI capex from the four hyperscalers is now tracking ~$700 billion, the largest concentrated infrastructure cycle in technology history, validating the structural re-rating underway in both sectors. Cons Discretionary also benefited from the broader risk-on rotation and strong corporate earnings momentum, with 84% of S&P 500 companies beating Q1 estimates, on track for the strongest beat rate since 2Q21.
Conversely, Energy (-3.5% MoM), Healthcare (-0.4% MoM), and Utilities (+2.1% MoM) underperformed the broader market. Energy was the notable laggard despite remaining a YTD leader (+33.5%), as markets began pricing in conflict de-escalation in the Middle East, with elevated earnings expectations and stretched valuations following the sector’s sharp run-up introducing meaningful mean-reversion risk. Healthcare extended its difficult stretch as the only sector negative on both an MTD and YTD basis, pressured by broad-based EPS estimate cuts, shrinking government reimbursements from legislation set to reduce federal healthcare spending by approximately $1 trillion over the next decade and fresh uncertainty from early-April pharmaceutical tariffs, are structural overhangs that kept the sector sidelined even as risk appetite recovered sharply elsewhere. Utilities posted a positive return but lagged materially, as the rotation into growth assets and a Fed holding rates steady diminished the appeal of defensive, yield-oriented holdings.
 Source: Bloomberg (Total Return in Local Currency terms)
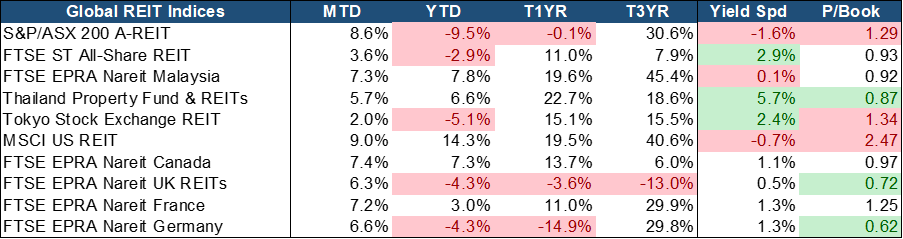
Global REITs staged a broad-based recovery in April, reversing the heavy institutional selling that had defined March as the Middle East ceasefire triggered a sharp repricing of risk and eased the inflation fears that had pressured rate-sensitive assets. The US REITs led the rebound (+9.0% MoM), buoyed by the strongest Q1 earnings beat rate in years and renewed conviction that the Fed’s rate path has peaked, while the Australian (+8.6% MoM) and Canadian (+7.4% MoM) REIT indices also posted strong recoveries. Meanwhile, Japan (+2.0% MoM) and Singapore (+3.6% MoM) lagged their peers, the former weighed by the Bank of Japan’s continued policy normalization trajectory and the latter reflecting S-REITs’ relatively more modest beta in risk-on environments given their already-defensive/quality positioning.
For S-REITs specifically, the investment thesis remains compelling and is gaining clarity. The sector continues to trade at an attractive 0.93x Price-to-Book (P/B), a meaningful discount to intrinsic value while offering a best-in-class trailing yield spread of 2.9%, the 3rd highest among developed REIT markets globally, providing a durable income cushion that is difficult to replicate in the current environment. Fundamentals on the ground remain firm, with Industrial S-REITs leading on rising Logistic/Warehouse and Data Centre (DC) demand while Retail REITs deliver high single-digit rental reversions supported by tight suburban supply and resilient footfall. 2026 is shaping up as a pivotal transition year, with lower interest expenses translating directly into distributable income and DPU growth expected to inflect meaningfully higher. With gearing levels manageable, balance sheets resilient, and valuations still at a meaningful discount to intrinsic value, S-REITs offer an increasingly compelling combination of visible income recovery and secular growth exposure, making the current level an attractive entry point for quality dividend-paying assets.
EQUITY MARKET OUTLOOK
Rates Backdrop and Market Sentiment:
 Source: Bloomberg.
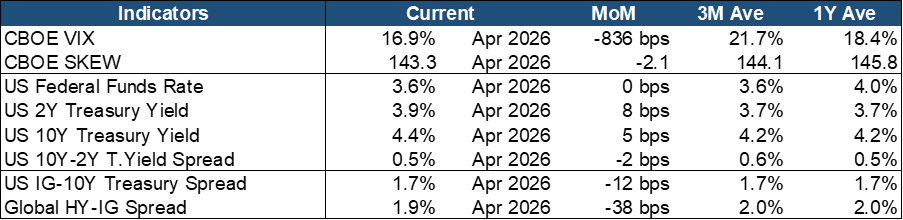
Market sentiment turned decisively risk-on in April, with implied volatility collapsing as the US–Iran ceasefire triggered a sharp repricing of geopolitical risk. The VIX index sharply decreased by 836 bps MoM, crossing below both the Trailing 3M (~21.7%) and 1Y (~18.4%) averages. This tells the narrative of a market steadily shedding its anxiety, with a tech-driven earnings rally and a steady-handed Federal Reserve doing the heavy lifting. The SKEW Index edged marginally lower to 143.3 but remained close to its short-term and 1Y averages, suggesting that while near-term fear was rapidly being unwound, investors continued to maintain meaningful tail-risk hedges against a resumption of geopolitical instability or a policy misstep.
Treasury Yields drifted modestly higher across the curve, rising 5–8 bps MoM, still in a mild Bear-Steepening trend, although it was a notable contrast to March’s more aggressive Bear-Flattening. The Fed elected to hold rates steady for a third consecutive meeting, specifically pointing to the elevated inflation and recent increase in global energy prices, while signaling that further cuts remain unlikely in the near term. The April decision also came on an 8-4 split vote, the most divided since 1992 and underscoring deepening internal disagreement during the Fed’s Chair transition. The 10Y–2Y spread fell slightly by 2 bps to 0.5%, consistent with a curve gradually normalizing rather than inverting. In the Credit space, the picture brightened materially where both the IG–Treasury spread and the HY–IG spread tightened by 12 bps and 38 bps respectively, retracing the risk-off widening from March as investor confidence in corporate fundamentals returned alongside the blowout Q1 earnings season.
Overall, April represented a clean pivot from March’s fearful, defensive positioning into broad-based risk appetite. The combination of a ceasefire-driven VIX collapse, resilient corporate earnings, and a Fed-on-hold backdrop gave investors the confidence to rotate aggressively back into growth and credit risk. Although, to note that the SKEW’s persistence and still-elevated Treasury yields serve as a reminder that the all-clear has not been fully sounded. Markets are now pricing stability, but with one eye still firmly on the Middle East and the incoming Fed leadership transition.
Macroeconomic Trends and Signals:
 Source: Bloomberg.
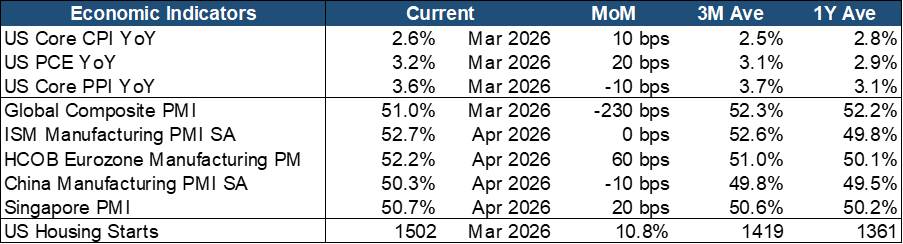
The March inflation data delivered a jarring headline, though the underlying picture remained more contained than the top-line numbers suggested. US CPI surged to 3.3% YoY, the highest since May 2024, driven almost entirely by energy. Critically, however, Core CPI rose just 10 bps MoM to 2.6% YoY, a tenth below forecast, ultimately indicating that underlying inflation had not materially re-accelerated. Similarly, the Core PPI fell by 1 bps MoM to 3.6% as businesses absorbed tariff costs into margins rather than passing them through. The Fed’s preferred gauge, PCE, climbed 20 bps MoM to 3.2% YoY, well above the 2% target, though policymakers have signaled their intent to look through the energy-driven distortion so long as the ceasefire holds and core pressures remain anchored. The key risk flagged by economists is secondary pass-through (i.e., higher transportation, logistics and fertilizer costs) that will feed into core goods and food prices over the coming months, a channel that had not yet fully materialized in the March data.
On the growth front, the global manufacturing cycle continued its steady expansion. The Global Composite PMI rose to 51.8, the US ISM Manufacturing PMI held firmly at 52.7 for a second consecutive month, its strongest sustained run since 2022. The Eurozone manufacturing PMI also pushed further into expansion at 52.2, buoyed by easing energy cost pressures following the ceasefire. China’s PMI edged marginally lower to 50.3 but remained above the expansion threshold for a second month, consistent with a stabilizing rather than accelerating domestic economy. Singapore’s PMI ticked up to 50.7, maintaining its position above 50 for the eighth consecutive month and reflecting resilient regional trade flows. US housing starts surged 10.8% MoM to 1,502 thousand units, well above the trailing averages, suggesting that the underlying demand for housing remains intact and that the brief rate spike in March had not derailed activity durably.
Taken together, the combination of an energy-driven but narrowly contained inflation shock and a manufacturing cycle that is holding its expansionary ground points to a complex but not broken macro backdrop where the Fed retains its cautious pause stance, watching carefully for any broadening of price pressures into core goods and services before reconsidering the path of rates.
Reality Check: Navigating a Market Caught Between AI Euphoria and Unresolved Macro Risk
April’s extraordinary rebound was a global relief rally layered on top of an already-strengthening AI earnings cycle. The risk-on drop in fear index, the snapback in credit spreads, and the broad rotation back into growth all speak to a market that was oversold in March and moved fast to correct that dislocation. Yet the sheer velocity of the recovery warrants careful interpretation. Not everything that drove March’s fear has been durably resolved, and distinguishing between what the market has priced and what has actually changed is now the central analytical challenge.
On the positive side, the earnings backdrop provides the clearest grounds for constructive positioning. The S&P 500’s Q1 beat rate is tracking at its strongest in nearly five years, and crucially, the outperformance is concentrated in exactly the sectors where the structural investment cycle is most active. Hyperscalers’ CapEx commitments represent a multi-year industrial cycle with compounding downstream effects across semiconductors, power infrastructure, logistics, and digital real estate. South Korea and Japan’s record-breaking monthly gains are a market signal that the global semiconductor upcycle is broadening, and Asia’s most AI-exposed markets are being repriced accordingly.
The near-term risks, however, cluster around three interconnected themes. Despite the equity market recovery, geopolitical tensions remain elevated and uncertain, any resumption of hostilities or breakdown in talks would rapidly reverse the energy-price normalization that underpinned April’s risk-on pivot. The inflation pipeline into Q2 is equally unresolved, with the April CPI print due mid-May set to be the first data point capturing both tariff pass-through and lingering energy cost transmission into goods and services, a combination that could complicate the Fed’s policy posture. Finally, incoming Fed Chair Kevin Warsh’s bias on price stability, inherited at a moment of deep FOMC division and above-target inflation, raises a credible tail risk that the rate path proves less accommodative than current market pricing implies.
The strategic read is therefore one of disciplined participation rather than wholesale risk-on. The most durable positioning lies in direct and indirect beneficiaries of the AI infrastructure cycle, where earnings visibility is highest and the structural demand signal is clearest regardless of near-term macro volatility. S-REITs present a compelling expression of this theme with a margin of safety attached, offering secular growth exposure through Logistics and DC demand at a meaningful valuation discount with the most attractive yield spread in the developed REIT universe. At the same time, concentration risk is real where markets are pricing a relatively smooth resolution of the Middle East conflict and a benign Fed transition, and neither outcome is assured. Maintaining quality bias within equities, staying attentive to duration risk in fixed income as the yield curve continues to normalize, and preserving optionality for a renewed volatility episode remain the prudent counterweights to an otherwise constructive positioning. Overall, the bull case is intact, but the error bars around it are still wide.
FIXED INCOME UPDATE
 Source: Bloomberg; Returns are presented in USD terms
Source: Bloomberg; Returns are presented in USD terms
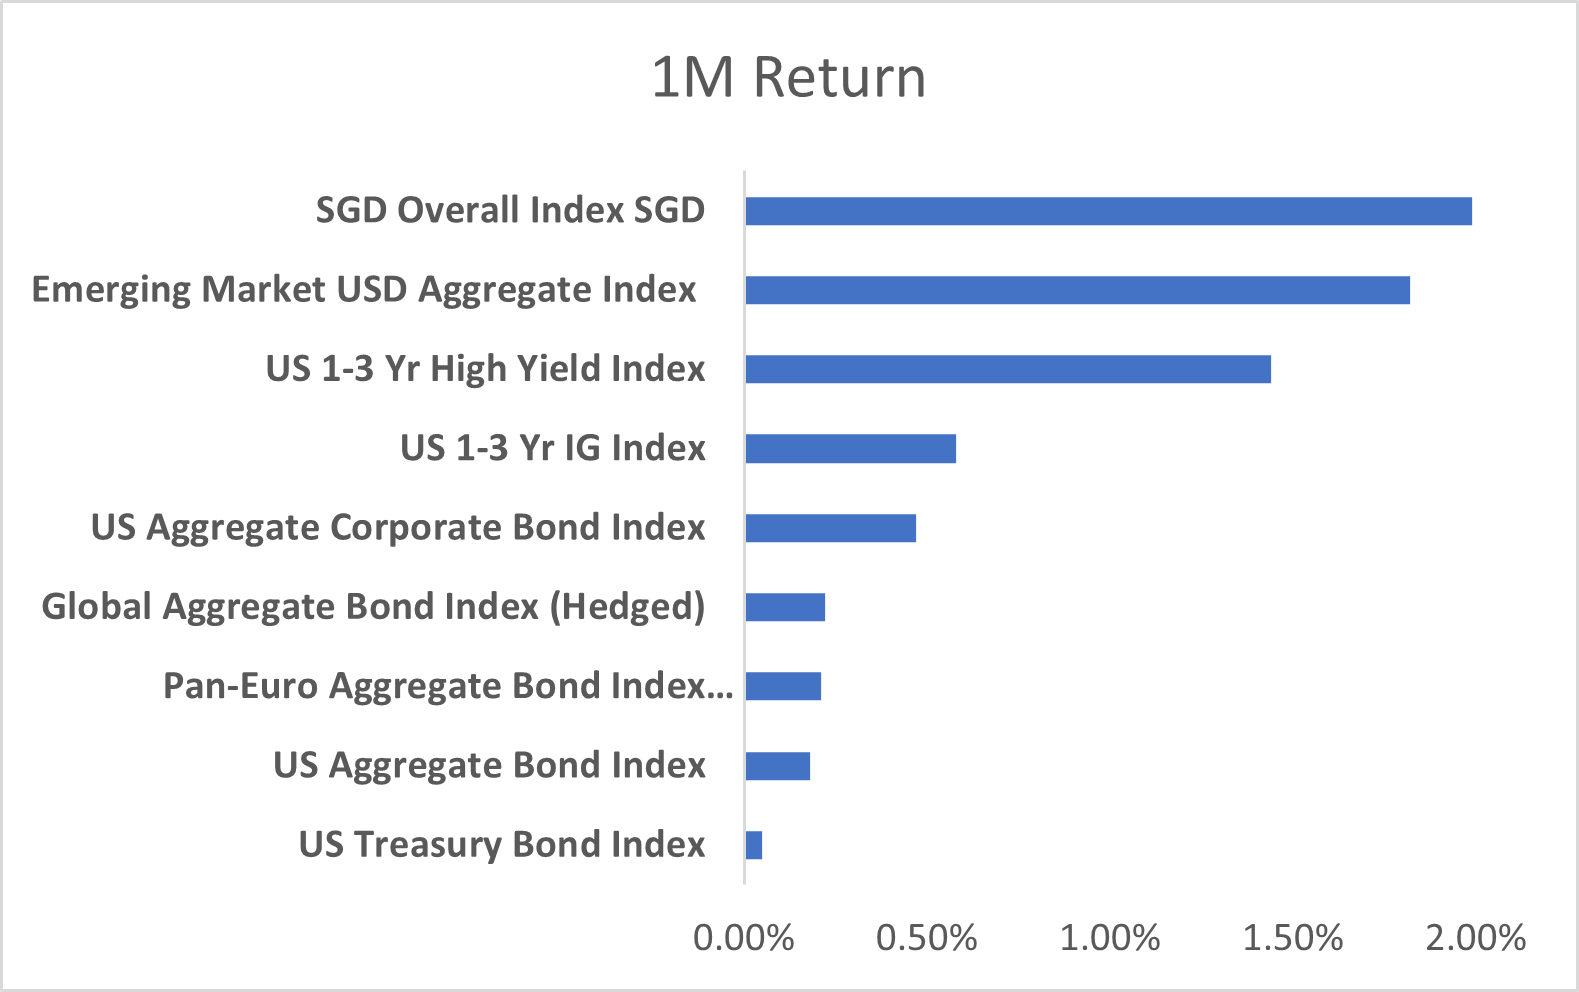
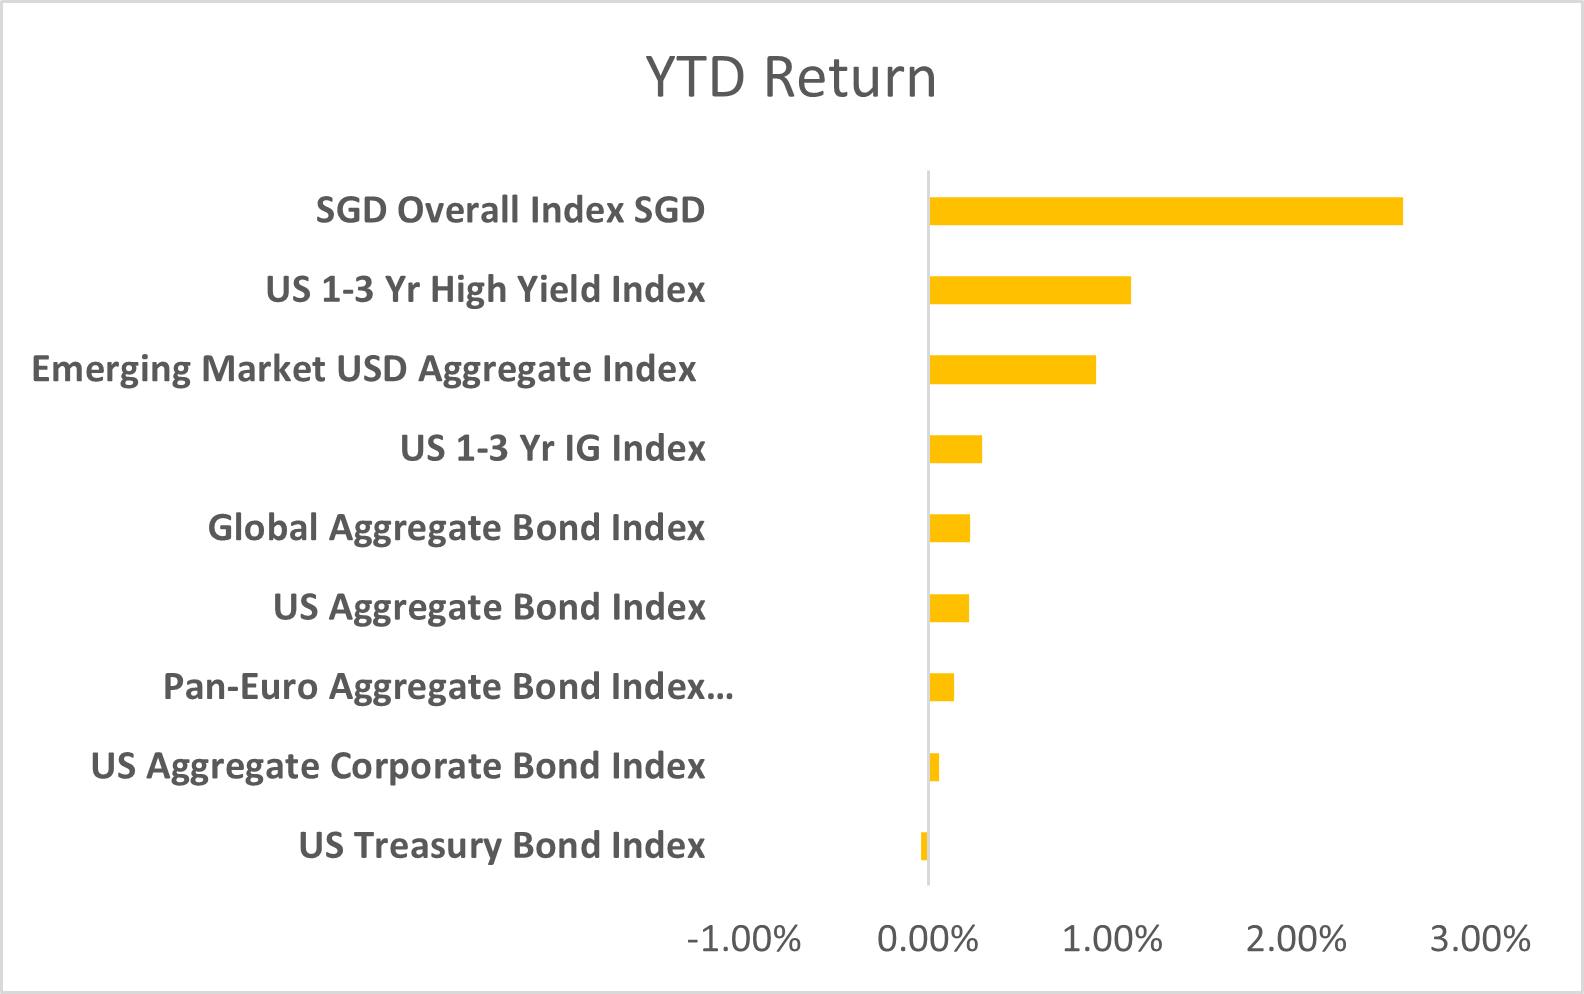
Bond markets staged a rebound in April, with most major indices posting positive returns as yields stabilized following March’s sharp sell‑off. The SGD Overall Index led the pack, returning close to 2% for the month and extending its YTD lead to nearly 3%. This recovery underscores the resilience of Singapore credit fundamentals and the supportive role of currency stability, reversing March’s laggard profile and re‑establishing SGD bonds as a global outperformer.
Emerging markets also delivered a strong performance, ranking as the second‑best performer in April. Attractive carry and resilient demand helped EM debt rebound sharply, reinforcing its position as one of the stronger performers on a YTD basis. The strength of EM underscores how investor appetite for yield and diversification continues to support the segment, even amid broader market volatility.
Developed markets saw more uneven results. While US corporates managed gains, the Pan‑Euro Aggregate and Global Aggregate indices continued to lag, with returns that were less than stellar both on the month and YTD. The full effects of the Iran war’s energy shock and higher inflation have yet to be fully priced in, particularly in Europe, where bond markets remain vulnerable to renewed rate volatility. US Treasuries and the broader US Aggregate posted modest advances, but Treasuries remain the only major benchmark still in negative territory YTD, underscoring how pure duration exposure is most at risk in a higher‑for‑longer environment.
Short‑duration indices once again showed their defensive appeal. The US 1–3 Year IG and High Yield benchmarks remained positive on a YTD basis, highlighting their lower sensitivity to duration risk in a volatile rate environment. Overall, April’s rebound highlights the divergence between resilient SGD credit strength, EM carry, and short‑duration defensiveness on the one hand, and the lingering weakness in Treasuries and European bonds on the other.
Inflation Risks and Policy Crosscurrents
April’s bond market narrative was defined by persistence rather than relief. Despite the rebound in prices, yields did not back off meaningfully, as the Iran war continued to exert a war premium on global markets. Elevated energy prices kept inflation expectations sticky, reinforcing the higher‑for‑longer regime and leaving investors cautious about duration risk.
Overlaying this was a policy transition at the Fed. Powell’s final press conference as chair underscored continuity in the cautious stance, but investors are already looking ahead to Kevin Warsh’s arrival. While no immediate shift has been signalled, the leadership change introduces uncertainty around communication style and inflation tolerance. Markets are watching closely to see whether the new chair will lean toward hawkish resolve or pragmatic flexibility in the face of persistent inflation.
Closer to home, MAS reaffirmed its commitment to maintaining the SGD NEER policy band in April, signalling steadiness amid global volatility. While the stance remained unchanged, the commentary acknowledged imported inflation risks from higher oil prices and geopolitical disruptions. This steady hand has helped anchor domestic funding conditions, reinforcing resilience of Singapore credit even as global peers struggled.
Important Information
This material is provided by Phillip Capital Management (S) Ltd (“PCM”) for general information only and does not constitute a recommendation, an offer to sell, or a solicitation of any offer to invest in any of the exchange-traded fund (“ETF”) or the unit trust (“Products”) mentioned herein. It does not have any regard to your specific investment objectives, financial situation and any of your particular needs. You should read the Prospectus and the accompanying Product Highlights Sheet (“PHS”) for key features, key risks and other important information of the Products and obtain advice from a financial adviser (“FA“) before making a commitment to invest in the Products. In the event that you choose not to obtain advice from a FA, you should assess whether the Products are suitable for you before proceeding to invest. A copy of the Prospectus and PHS are available from PCM, any of its Participating Dealers (“PDs“) for the ETF, or any of its authorised distributors for the unit trust managed by PCM.
An ETF is not like a typical unit trust as the units of the ETF (the “Units“) are to be listed and traded like any share on the Singapore Exchange Securities Trading Limited (“SGX-ST”). Listing on the SGX-ST does not guarantee a liquid market for the Units which may be traded at prices above or below its NAV or may be suspended or delisted. Investors may buy or sell the Units on SGX-ST when it is listed. Investors cannot create or redeem Units directly with PCM and have no rights to request PCM to redeem or purchase their Units. Creation and redemption of Units are through PDs if investors are clients of the PDs, who have no obligation to agree to create or redeem Units on behalf of any investor and may impose terms and conditions in connection with such creation or redemption orders. Please refer to the Prospectus of the ETF for more details.
Investments are subject to investment risks including the possible loss of the principal amount invested, and are not obligations of, deposits in, guaranteed or insured by PCM or any of its subsidiaries, associates, affiliates or PDs. The value of the units and the income accruing to the units may fall or rise. Past performance is not necessarily indicative of the future or likely performance of the Products. There can be no assurance that investment objectives will be achieved. Any use of financial derivative instruments will be for hedging and/or for efficient portfolio management. PCM reserves the discretion to determine if currency exposure should be hedged actively, passively or not at all, in the best interest of the Products. The regular dividend distributions, out of either income and/or capital, are not guaranteed and subject to PCM’s discretion. Past payout yields and payments do not represent future payout yields and payments. Such dividend distributions will reduce the available capital for reinvestment and may result in an immediate decrease in the net asset value (“NAV”) of the Products. Please refer to <www.phillipfunds.com> for more information in relation to the dividend distributions.
The information provided herein may be obtained or compiled from public and/or third party sources that PCM has no reason to believe are unreliable. Any opinion or view herein is an expression of belief of the individual author or the indicated source (as applicable) only. PCM makes no representation or warranty that such information is accurate, complete, verified or should be relied upon as such. The information does not constitute, and should not be used as a substitute for tax, legal or investment advice.
The information herein are not for any person in any jurisdiction or country where such distribution or availability for use would contravene any applicable law or regulation or would subject PCM to any registration or licensing requirement in such jurisdiction or country. The Products is not offered to U.S. Persons. PhillipCapital Group of Companies, including PCM, their affiliates and/or their officers, directors and/or employees may own or have positions in the Products. This advertisement has not been reviewed by the Monetary Authority of Singapore.
