

Market Commentary – August 2026
EQUITY MARKET UPDATE
Source: Bloomberg (Total Return in USD/Local Currency terms)
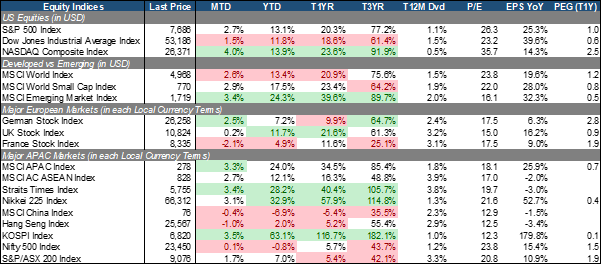
Nasdaq (+4.0% MTD) led the S&P 500 (+2.7% MTD) and the Dow (+1.5% MTD) as AI and tech names rebounded from July’s selling. The S&P 500 and the Dow hit all-time highs on 5 August on strong 2Q earnings. The S&P 500 set another record on 13 August after a softer July inflation print eased fears of a September hike, and it is up 13.1% YTD. Warsh’s Jackson Hole speech on 28 August put a hike back on the table, but the market held its gains. Nvidia’s 2Q results released on 26 August (revenue +106% YoY, 3Q revenue guided +12% QoQ) settled the semiconductor names.
Europe equities were mixed. Germany (+2.5% MTD) outperformed France (-2.1% MTD) on the same rates backdrop: the 10Y Bund at a cycle high of 3.32% and an ECB signaling it could raise rates. Germany benefited from its industrial tilt as Eurozone manufacturing PMI rose to 52.7. France lagged on its budget crisis, with OAT yields near 2008 highs and political gridlock weighing on French companies. The UK (+0.2% MTD) was flat. The FTSE 100 has few AI and tech names, so it missed the AI-led rally.
APAC was split. Korea (+3.5% MTD) and Japan (+3.1% MTD) rose on their position in the semiconductor and AI supply chain. HBM3E spot prices were four to five times contract prices, DRAM export prices rose 37% between May and July, and Samsung and SK Hynix are expected to report record 3Q profits. Korea is up 63.1% YTD and Japan 32.9% YTD. Singapore (+3.4% MTD, +28.2% YTD) rose on the banks. DBS, OCBC and UOB grew 2Q profit by 9%, 22% and 10% on fee and wealth income, even as NIMs fell 8 to 22 bps. MTI raised its 2026 GDP forecast to 4.5 to 5.5% from 2.0 to 4.0% after 2Q GDP of +5.9% YoY. Hong Kong (-1.0% MTD) fell on Tencent, which dropped after results on 13 August, and Alibaba, whose US$10.2bn placement on 24 August to fund AI capex took the Hang Seng down 2% intraday. China (-0.4% MTD) lagged as July activity data missed on retail sales, investment and unemployment, and August manufacturing PMI stayed in contraction at 49.8. The IPO pipeline stayed strong: Shein listed in Hong Kong on 31 August, and more than US$54bn has been raised YTD across Hong Kong and Shanghai.
 Source: Bloomberg (Total Return in USD terms)
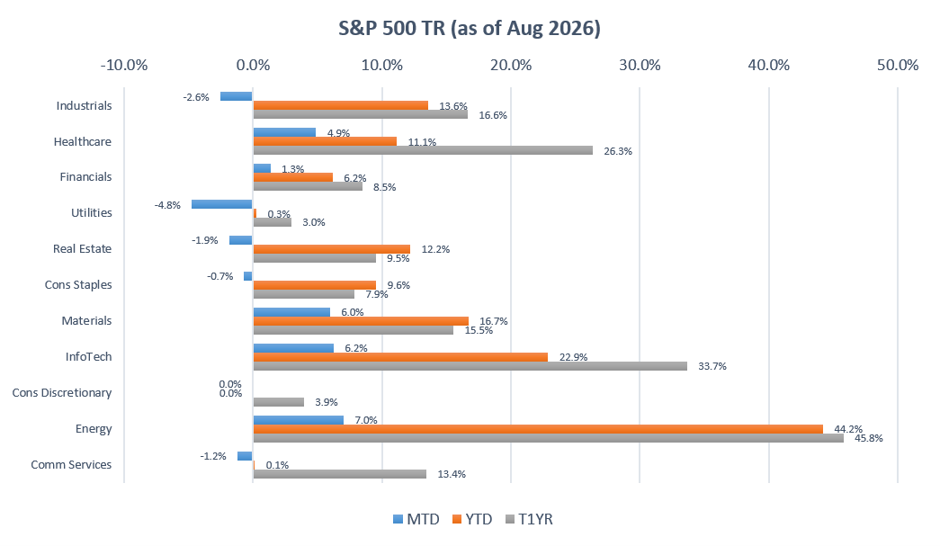
Energy (+7.0% MTD), InfoTech (+6.2% MTD), Materials (+6.0% MTD) and Healthcare (+4.9% MTD) led. Energy rose on the Hormuz risk premium and US gasoline above US$4 a gallon every day of August. The US struck Iranian positions along the Strait of Hormuz on 30 August, the first strike in a month, and Brent closed the month at about US$91. Energy is the only sector to lead two months running and is the year’s best at +44.2% YTD. InfoTech rebounded as software led and Nvidia’s results settled the semiconductor names. Materials rose with gold (about +10% in August) and copper at record highs. Healthcare gained on Moderna, which surged 177% on 19 August after its cancer vaccine with Merck passed its Phase 3 trial, and on a defensive rotation.
Utilities (-4.8% MTD), Industrials (-2.6% MTD), Real Estate (-1.9% MTD) and Comm Services (-1.2% MTD) lagged. Utilities fell as long yields rose and the AI power trade narrowed to the power generators. The sector is flat YTD (+0.3%). Industrials fell for a second month as the AI data-centre capex names that drove its June rally gave back. Caterpillar is down about 25% since end-June, and with GE Aerospace it makes up about 15% of the sector. Real Estate fell as the odds of a Fed hike rose after Jackson Hole, given it is the most rate-sensitive sector. Comm Services slipped despite the tech rally and is flat YTD (+0.1%).
Source: Bloomberg (Total Return in Local Currency terms)
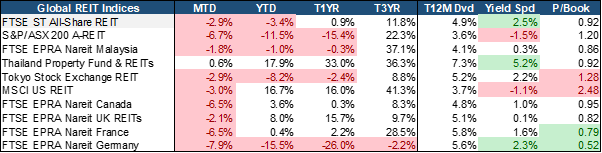
Global REITs fell with US Real Estate as the odds of a Fed hike rose after Jackson Hole. Germany (-7.9% MTD), Australia (-6.7% MTD), Canada (-6.5% MTD) and France (-6.5% MTD) fell the most. US REITs (-3.0% MTD) are still up 16.7% YTD. Thailand (+0.6% MTD) was the only REIT market to record a positive performance while having the widest yield spread in the table at 5.2%. In contrast, Australia (-1.5%) and the US (-1.1%) have the narrowest yield spread among the REIT markets.
S-REITs (-2.9% MTD) fell with the group and are down 3.4% YTD, against an STI which rose 28.2% YTD. The sector trades at 0.92x price-to-book with a 4.9% dividend yield and a 2.5% spread over the Singapore government 10Y bond yields. Higher benchmark yields drove the underperformance in REITs as Federal Fund rate hike odds rose after the Jackson Hole Symposium and long-term yields are rising globally. Duration is the main risk for the REIT sector going into the 16th September FOMC meeting.
EQUITY MARKET OUTLOOK
Rates Backdrop and Market Sentiment:
Source: Bloomberg.
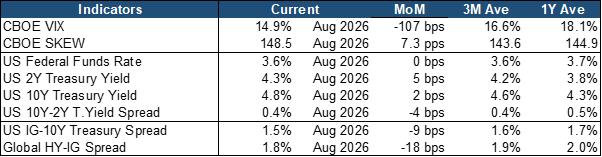
VIX fell for a third straight month to 14.9% (-107 bps MoM), below its 3M (16.6%) and 1Y (18.1%) averages. This was despite the US-Iran strike on the last trading day and the July jobs report on 7 August, which showed the US lost 23,000 jobs. The SKEW Index rose 7.3 points to 148.5, above its 3M (143.6) and 1Y (144.9) averages. Low VIX coupled with a high SKEW is the same setup as June, which was followed by a narrow AI-led drawdown rather than a broad market decline.
Treasury yields were stable, but the market moved from pricing cuts to debating a hike. Fed funds rate stayed at 3.6% with no FOMC meeting taking place in August. The 2Y rose 5 bps to 4.3% and the 10Y was little changed at 4.8%. Both are above their 3M and 1Y averages. The 10Y-2Y spread was little changed at 0.4% (-4 bps MoM). Warsh’s Jackson Hole speech on 28 August was construed as hawkish where he labelled 2% inflation as a “firm, fixed target”, while noting that 49% of the PCE basket’s constituents are running at an annualized rate above 3%. Furthermore, the Fed will reduce the frequency and explicitness of forward policy guidance. By the end of the month, the key question surrounding the September FOMC decision outcome had evolved to either a hike or hold, as prospects of a policy rate cut grow increasingly improbable. Larger yield movements were observed outside of the US: the 10Y Bund hit a cycle high of 3.32%, the 10Y JGB hit 2.94%, a roughly 30-year high, and 10Y OATs were near 2008 highs.
Credit spreads tightened across both measures indicating that the funding market is not worried about the AI buildout yet. The IG-Treasury spread tightened 9 bps to 1.5%, below its 3M (1.6%) and 1Y (1.7%) averages. The Global HY-IG spread tightened 18 bps to 1.8%, below both its 3M (1.9%) and 1Y (2.0%) historical averages. While July’s widening in both credit spreads appears to suggest investor concerns over AI capex funding stress, August’s spread compression formed a retracement of the past spread widening.
Macroeconomic Trends and Signals:
Source: Bloomberg.
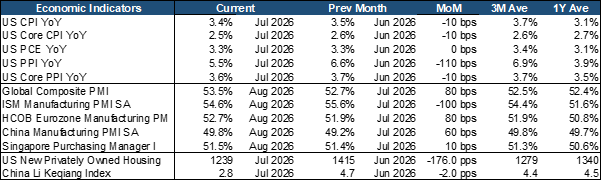
Headline and core CPI eased, but the Fed’s preferred gauge did not. Headline CPI fell 10 bps to 3.4% YoY and core CPI to 2.5%, below its 1Y average of 2.7% for a second month. Core PCE held at 3.3% YoY, above its 1Y average of 3.1% and 130 bps above target. PPI fell to 5.5% YoY from 6.6% and core PPI to 3.6%. Declines within price indices for consumer and wholesale inflation for July 2026 were largely driven by falling energy costs and cooling demand.
China and US housing are the only growth signals that turned. China’s manufacturing PMI stayed in contraction at 49.8 for a second month, the Li Keqiang Index fell to 2.8 from 4.7 (1Y average 4.5), and China’s OECD CLI (98.1) is the only one of the three falling. US housing starts dropped to 1,239k from 1,415k, the largest move in the table, and are below their 3M (1,279k) and 1Y (1,340k) averages. With 10Y treasury yields at 4.8%, the more rate-sensitive parts of the economy are where we are seeing weakness in marginal data. Global Composite PMI rose 80 bps to 53.5, above its 1Y average of 52.4, Eurozone manufacturing rose to 52.7 and Singapore to 51.5. US ISM Manufacturing eased 100 bps to 54.6 but is still well above its 1Y average of 51.6.
Robust economic activity data, leading indicators and credit spreads are aligned with the reality that economic momentum remains intact. Market participant expectations pivoting from the next Fed move being of a hold or hike from the previous cut and the higher yields in rates markets were not detrimental to equity performances as earnings growth ran ahead of current valuation multiples. That holds as long as 2Q earnings growth is not at the peak.
Outlook: The market has priced a tighter Fed and kept rallying
August delivered a CPI that fell, a core PCE that did not, a Fed chair who said he has “work to do”, and a September hike as a live question. The S&P 500 made two record highs anyway.
Earnings are the reason. Equities are no longer being carried by the discount rate. They are being carried by earnings growth, and Nvidia’s 3Q guide (+12% QoQ) is now the number the whole AI complex is discounting.
The next catalyst is the 16 September FOMC, with the 11 September CPI as the setup. A hike with a hawkish path would hit the rate-sensitive sectors, REITs and Utilities, first. Duration is the main risk. The 10Y at 4.8% is above its averages, long yields are still rising globally, and REITs and Utilities already fell on this in August.
We stay invested, with a preference for markets and sectors where earnings growth is driving returns: Korea, Japan, EM, Energy, Materials and Financials. We are cautious on those that have re-rated on flat or falling earnings, such as Singapore and Healthcare. Singapore’s banks grew profit in 2Q, but NIMs are still falling and index earnings are down YoY. Further upside needs earnings to recover, not just a higher multiple.
FIXED INCOME UPDATE
 Source: Bloomberg; Returns are presented in USD terms
Source: Bloomberg; Returns are presented in USD terms
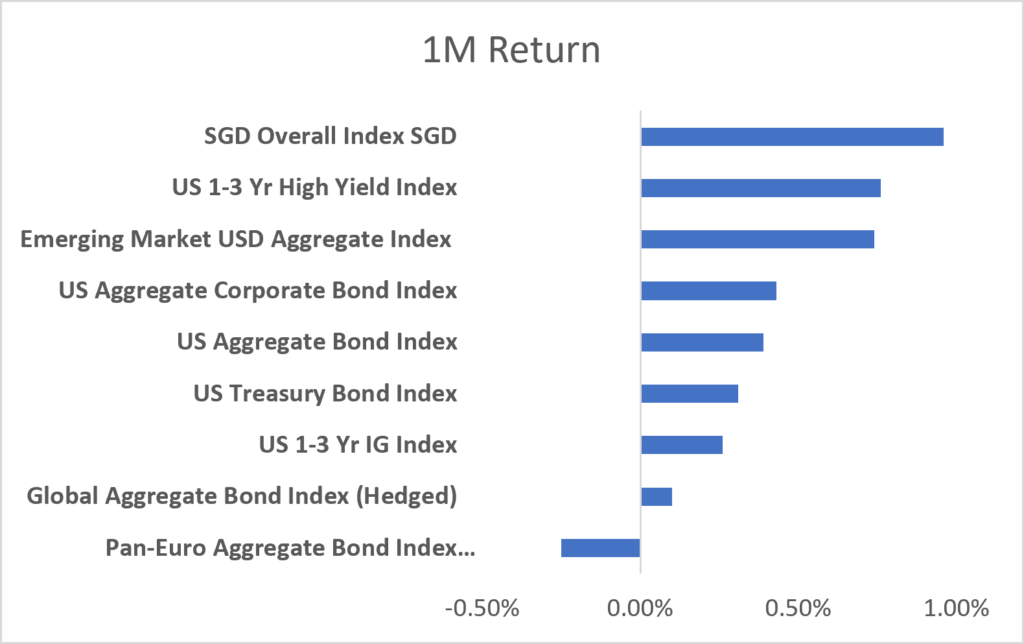
Global bond markets posted broadly positive returns in August despite ongoing volatility in sovereign bond markets. The SGD Overall Index emerged as the strongest performer, gaining close to 1.0% in USD terms, supported by resilient bond performance and favourable currency translation effects as the Singapore dollar strengthened against the US dollar. Carry-oriented sectors also remained in favour, with the US 1–3 Year High Yield Index and Emerging Market USD Aggregate Index delivering solid gains. Meanwhile, US Treasury and aggregate bond benchmarks posted more modest returns as long-term yields continued to trend higher. The Pan-Euro Aggregate Bond Index was the only benchmark in our universe to finish the month in negative territory, reflecting the pressure on duration-sensitive assets as European sovereign yields moved higher amid renewed inflation concerns.
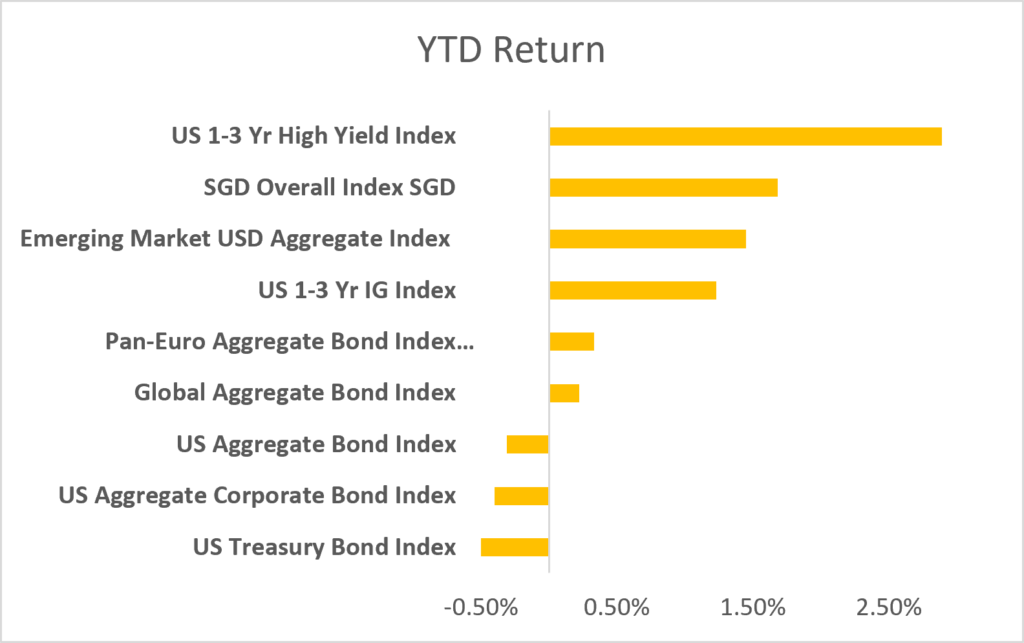
On a year-to-date basis, carry continues to drive performance. The US 1–3 Year High Yield Index remains the strongest performer with returns approaching 3.0%, while the SGD Overall Index has rebounded to become one of the better-performing benchmarks year-to-date. Emerging Market USD Debt and the US 1–3 Year Investment Grade Index also continue to post respectable gains. By contrast, US Treasuries, US Aggregate Corporates and the broader US Aggregate Bond Index remain in negative territory as investors demand higher compensation for duration risk.
Bond Vigilantes Re-emerge as Global Yields March Higher
The global fixed income landscape underwent a notable shift in August as sovereign bond yields rose across major markets and concerns over fiscal sustainability re-emerged. Market sentiment was further unsettled after U.S. Treasury Secretary Scott Bessent disclosed details surrounding coordinated intervention efforts in the Japanese Yen. While intended to stabilise currency markets, the episode highlighted the fragility of cross-border capital flows and the potential for foreign exchange volatility to spill over into bond markets. Against a backdrop of persistent inflationary pressures and elevated government borrowing needs, investors demanded greater compensation for holding longer-dated bonds, pushing yields higher across much of the developed world.
At the same time, a growing disconnect emerged between monetary policy rhetoric and market pricing, underscoring the return of bond vigilantism. Despite Federal Reserve Chair Kevin Warsh’s attempts to balance inflation concerns with assurances around financial stability, investors remained focused on resilient economic growth, widening fiscal deficits and sustained Treasury issuance. The Treasury Department’s subsequent decision to expand long-dated bond buybacks, drawing comparisons to a modern-day “Operation Twist”, reinforced concerns over rising borrowing costs and mounting pressure at the long end of the curve. While the measures provided temporary relief, they did little to alter the market’s broader view that higher term premia may be required to absorb the growing supply of government debt.
The move in U.S. Treasury yields has reignited debate over whether the benchmark 10-year Treasury could ultimately approach the 5% level. While such projections remain uncertain, the underlying arithmetic is becoming increasingly difficult to ignore. Viewed through the lens of the Fisher equation, structural real GDP growth of 1.5% to 2.0% combined with core inflation above 3% implies a nominal growth backdrop that is materially stronger than that which prevailed during much of the post-GFC era. Added to this is a widening fiscal deficit and a growing supply of Treasury issuance, requiring investors to absorb more government debt and demand greater compensation for duration risk. In this context, a 5% handle on the 10-year Treasury no longer appears as remote as it once did, with implications for borrowing costs, asset valuations and capital allocation decisions globally.
Important Information
This material is provided by Phillip Capital Management (S) Ltd (“PCM”) for general information only and does not constitute a recommendation, an offer to sell, or a solicitation of any offer to invest in any of the exchange-traded fund (“ETF”) or the unit trust (“Products”) mentioned herein. It does not have any regard to your specific investment objectives, financial situation and any of your particular needs. You should read the Prospectus and the accompanying Product Highlights Sheet (“PHS”) for key features, key risks and other important information of the Products and obtain advice from a financial adviser (“FA“) before making a commitment to invest in the Products. In the event that you choose not to obtain advice from a FA, you should assess whether the Products are suitable for you before proceeding to invest. A copy of the Prospectus and PHS are available from PCM, any of its Participating Dealers (“PDs“) for the ETF, or any of its authorised distributors for the unit trust managed by PCM.
An ETF is not like a typical unit trust as the units of the ETF (the “Units“) are to be listed and traded like any share on the Singapore Exchange Securities Trading Limited (“SGX-ST”). Listing on the SGX-ST does not guarantee a liquid market for the Units which may be traded at prices above or below its NAV or may be suspended or delisted. Investors may buy or sell the Units on SGX-ST when it is listed. Investors cannot create or redeem Units directly with PCM and have no rights to request PCM to redeem or purchase their Units. Creation and redemption of Units are through PDs if investors are clients of the PDs, who have no obligation to agree to create or redeem Units on behalf of any investor and may impose terms and conditions in connection with such creation or redemption orders. Please refer to the Prospectus of the ETF for more details.
Investments are subject to investment risks including the possible loss of the principal amount invested, and are not obligations of, deposits in, guaranteed or insured by PCM or any of its subsidiaries, associates, affiliates or PDs. The value of the units and the income accruing to the units may fall or rise. Past performance is not necessarily indicative of the future or likely performance of the Products. There can be no assurance that investment objectives will be achieved. Any use of financial derivative instruments will be for hedging and/or for efficient portfolio management. PCM reserves the discretion to determine if currency exposure should be hedged actively, passively or not at all, in the best interest of the Products. The regular dividend distributions, out of either income and/or capital, are not guaranteed and subject to PCM’s discretion. Past payout yields and payments do not represent future payout yields and payments. Such dividend distributions will reduce the available capital for reinvestment and may result in an immediate decrease in the net asset value (“NAV”) of the Products. Please refer to <www.phillipfunds.com> for more information in relation to the dividend distributions.
The information provided herein may be obtained or compiled from public and/or third party sources that PCM has no reason to believe are unreliable. Any opinion or view herein is an expression of belief of the individual author or the indicated source (as applicable) only. PCM makes no representation or warranty that such information is accurate, complete, verified or should be relied upon as such. The information does not constitute, and should not be used as a substitute for tax, legal or investment advice.
The information herein are not for any person in any jurisdiction or country where such distribution or availability for use would contravene any applicable law or regulation or would subject PCM to any registration or licensing requirement in such jurisdiction or country. The Products is not offered to U.S. Persons. PhillipCapital Group of Companies, including PCM, their affiliates and/or their officers, directors and/or employees may own or have positions in the Products. This advertisement has not been reviewed by the Monetary Authority of Singapore.
