

Market Commentary – September 2026
EQUITY MARKET UPDATE
Source: Bloomberg (Total Return in USD/Local Currency terms)
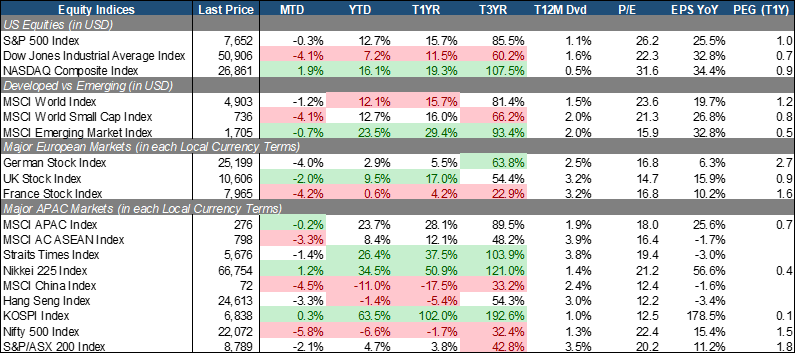
U.S. equities concealed a broader deterioration beneath resilient technology leadership. The S&P 500 slipped modestly (-0.3% MTD), while the Dow fell sharply (-4.1% MTD) and the Nasdaq advanced (+1.9% MTD). The divergence matters because the MSCI World Small Cap Index also lost 4.1%, suggesting that the headline index understated the pressure experienced by other more rate-sensitive segments of the market such as smaller-cap equities. September’s Fed rate hike reinforced challenges stemming from higher borrowing costs, even as the central bank described domestic spending, labour markets and capital investment as resilient. Re-escalations in US-Iran tensions following the rejection of an Iranian proposal to reopen the Straits of Hormuz also saw oil prices and inflation expectations rise.
Europe weakened across all three major markets, with France (-4.2% MTD) and Germany (-4.0% MTD) falling more than the UK (-2.0% MTD). The ECB raised rates in September as the Middle East conflict continued to generate inflation pressures, leaving the region exposed to both higher energy costs and tighter monetary conditions. Manufacturing activity improved, but that was insufficient to sustain equity valuations. German and French equities each trade at 16.8x P/E, with the UK at 14.7x, compared with 26.2x for the S&P 500. The valuation gap remains meaningful, although a lower multiple alone offers limited protection when the discount rate is rising and earnings visibility is uneven. Valuation continues to provide support for the region, with the DAX (16.8x), CAC (16.8x) and the UKX (14.7x) hovering near their 10-year averages contrasting against the S&P 500 which was nearing 1 standard deviation above its 10-year average.
APAC remains sharply divided. Japan’s Nikkei 225 (+1.2% MTD) and South Korea’s KOSPI (+0.3% MTD) held up, taking their YTD gains to 34.5% and 63.5% respectively. China (-4.5% MTD) and Hong Kong (-3.3% MTD) weakened despite China’s manufacturing PMI returning to expansion based on the most recent data print. Signs of any short-term recovery momentum are often constrained by the underlying weak domestic demand and the property downturn, with additional credit and housing support announced towards month-end. India was the weakest major APAC market, with the Nifty 500 down 5.8% MTD, coupled with Australia which fell 2.1% MTD. ASEAN (-3.3% MTD) and Singapore (-1.4% MTD) also retreated, although the STI still gained a substantial 26.4% on a YTD basis. The regional landscape within the month of September points towards selectivity: markets that outperformed such as Japan and Korea held on better after a stellar YTD performance, while other markets on cheaper valuations such as Greater China still require better clarity on corporate earnings support or a turnaround on the bearish momentum afflicting Chinese equities.
 Source: Bloomberg (Total Return in USD terms)
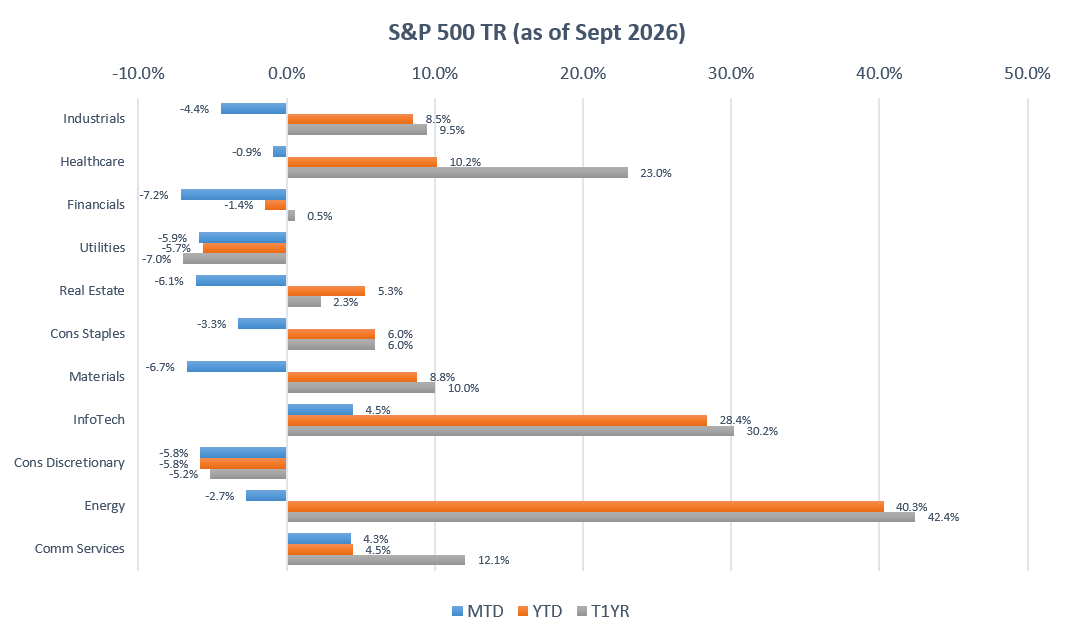
September’s sector performance showed how narrow U.S. market leadership had become. InfoTech (+4.5% MTD) and Communication Services (+4.3% MTD) were the only sectors to advance, while Healthcare (-0.9% MTD) was the most resilient among the decliners. InfoTech’s gain lifted its YTD return to 28.4%, driven by outperformance from the semiconductor and semiconductor equipment segments. Investor preferences have favoured businesses with visible earnings growth or are better equipped to navigate the rising financing cost landscape as yields trend higher. This also concentrates index performance drivers along a narrower subset of sectors. The overall resilience of the S&P 500 therefore paints an incomplete picture in capturing September’s deterioration in breadth of outperforming sectors, which is particularly salient for portfolios with greater exposure to the US economy and more rate-sensitive sectors. Investors should also recognize that the sectors which generally outperformed within the month of September are presently trading on P/E multiples richer than their trailing 10-year averages, potentially raising concerns on stretched valuation multiples should earnings growth underwhelm relative to expectations.
On the other end, Financials (-7.2% MTD), Materials (-6.7% MTD), Real Estate (-6.1% MTD) formed the weakest sectors. While Treasury yields increased sharply over the course of September, the bear flattening of the yield curve ultimately was a negative for the Financials sector as the compression in term premium leads towards tighter net interest margins. Rising Treasury yields also provided a difficult backdrop for property and utility valuations, given the adverse impact of a higher discount factor on future cashflows accruing to these two sectors.
Source: Bloomberg (Total Return in Local Currency terms)
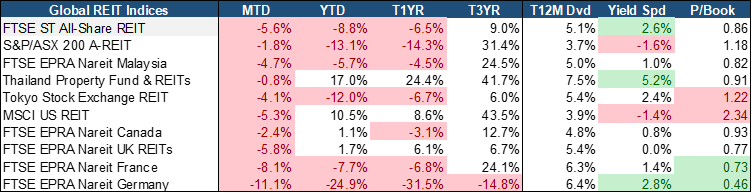
Global REIT markets saw negative momentum from August into September, as the acceleration in the rise in bond yields exerted further pressure on valuations. Germany (-11.1% MTD) and France (-8.1% MTD) suffered the largest losses, followed by the UK (-5.8% MTD). Thailand (-0.8% MTD) was the most resilient market and retained the strongest YTD return at 17.0%, supported by a more modest increase to benchmark yields compared to other geographical markets. Despite September’s decline, U.S. REITs remained positive (+10.5% YTD), whereas Germany’s losses deepened to -24.9%. The dispersion highlights the importance of financing structures and asset quality. Discounts to book value may offer opportunities, but their significance depends on the durability of property valuations and the ability to refinance without eroding distributions.
S-REITs declined 5.6% MTD, taking their YTD return to -8.8%. The sector trades at 0.86x Price-to-Book, with a trailing dividend yield of 5.1% and a yield spread of 2.6%. These valuations provide a basis for selective investment, but a discount to book is insufficient without confidence in distributable income and asset values. We favour REITs with sustainable occupancy, positive rental reversions and manageable refinancing requirements. The extent of fixed-rate debt, interest coverage and the timing of debt maturities are particularly relevant in the current rising yield environment given their direct impact on the sustainability and magnitude of distribution growth.
EQUITY MARKET OUTLOOK
Rates Backdrop and Market Sentiment:
Source: Bloomberg.
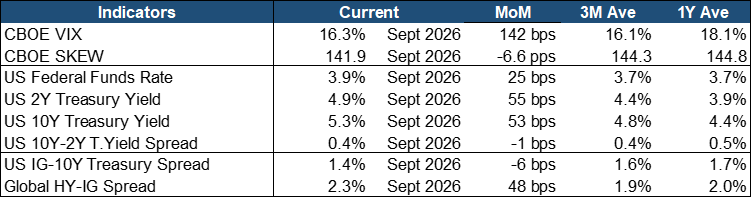
Equity volatility increased modestly but did not indicate broad market stress. The VIX ended in September at 16.3, slightly above its 3-month average of 16.1 but below its 1-year average of 18.1. SKEW declined 6.6 points to 141.9, below its 3-month and 1-year averages of 144.3 and 144.8 respectively. Both readings in conjunction suggest that while equity markets weakened, the likelihood of tail risk in contrast has ebbed away over this period. Given narrow equity leadership and higher bond yields, it would be prudent to retain appropriate downside protection instead of holding the view that underlying risks have diminished.
Treasury yields rose sharply across the curve as monetary policy tightened. Following a 25bps policy rate increase, the effective federal funds rate stood at 3.9%, an increase of 30bps over the prior month. The 2Y Treasury yield rose 55bps to 4.9%, while the 10Y increased 53bps to 5.3%, above their respective 1-year averages of 3.9% and 4.4%. The 10Y–2Y spread was broadly unchanged at on a net basis at 0.4%, instead yields took a largely parallel shift upwards. This matters for equities because both near-term financing costs and longer-term discount rates have increased. The Fed’s emphasis on resilient activity and elevated inflation supported a reassessment of the policy outlook, while energy uncertainty remained an additional risk to inflation expectations.
Credit performance became more differentiated. The U.S. IG–10Y Treasury spread tightened 6 bps to 1.4%, below its 1-year average of 1.7%, while the Global HY–IG spread widened 48 bps to 2.3%, above its 1-year average of 2.0%. This divergent behaviour points to greater compensation offered by lower credit quality fixed income relative to investment grade, indicative of flight to safety flows gaining traction. Nevertheless, the divergence strengthens the case for balance-sheet selectivity especially if higher financing costs or softer operational outlook translates into deterioration in credit fundamentals.
Macroeconomic Trends and Signals:
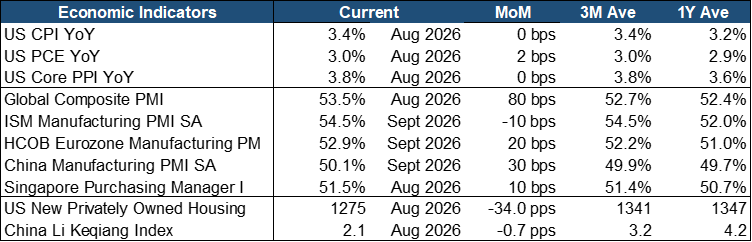
Source: Bloomberg. PCE shown corresponds to core PCE [5]; PMIs are index levels.
Inflation remained persistent in the latest available readings. August CPI held at 3.4% YoY, above its 1-year average of 3.2%, while Core PPI was unchanged at 3.8% YoY versus a 1-year average of 3.6%. The Fed’s preferred inflation gauge, the core PCE, was largely unchanged at 3.0% from the previous month, despite staying above its 1-year average. The figures point to effects stemming from past tariff actions, geopolitical developments and increase to tech-related consumer goods associated with the AI buildout. The Fed’s September rate hike decision emphasized the intent of policymakers to restore price stability and maintain policy credibility, backed by the perception that economic growth and labour markets are still holding up well.
Global activity remained expansionary. September ISM Manufacturing eased to 54.5, while the Eurozone manufacturing PMI improved to 52.9. China’s manufacturing PMI returned just above the expansion threshold at 50.1. The lagged August readings also showed growth, with the Global Composite PMI at 53.5 and Singapore’s PMI at 51.5. However, China’s Li Keqiang Index fell 0.7 points to 2.1 in August, well below its 1-year average of 4.2. We continue to observe the divergence between the expansionary China Manufacturing PMI and the softening Li Keqiang Index, which could point towards overall economic growth being driven by sectors hailing from the New Economy rather than those in the Old Economy.
Overall, September delivered macro conditions combining resilient activity, persistent inflation, and higher cost of capital. Technology cushioned the indices, but weaker breadth and wider HY-IG spreads strengthen the case for selectivity in prioritizing earnings quality and firms better placed to navigate a higher financing cost environment.
Outlook: Narrower Leadership and a Higher Cost of Capital
September reinforced the importance of looking beyond headline index returns. The S&P 500’s modest monthly decline concealed broad sector weakness, while the Nasdaq and technology-linked Asian markets displayed resilient indicating continued investor faith in the AI theme. We remain constructive on companies capable of generating durable earnings growth and ability to deliver monetization on past capex spending. Materialization of earnings growth in tech-sector names also bring about convergence of equity valuation multiples closer to the index average, partly allaying past concerns of overstretched valuations.
The policy outlook remains a key source of uncertainty. September’s Fed increase, together with tightening by the ECB and Bank of Japan, demonstrates that persistent inflation ensured that the hurdle for policy relief have risen. However, the U.S. employment report released on 2nd October showed slower hiring, downward revisions to data from earlier months alongside a slight uptick to unemployment rate to 4.3%, tempering the argument for an uninterrupted sequence of rate increases. Slower hiring also warrants closer scrutiny of consumer demand and earnings. Stabilization in energy prices and further moderation in underlying inflation would lead to a shallower rate hike sequence thereby supporting equity valuations.
We remain constructive on selected AI beneficiaries, while placing greater emphasis on the economics of the investment cycle. AI hardware earnings have held up against investor expectations, and the Infotech sector have logged in consecutive monthly gains over the past two months.
Against this backdrop, we would retain selective exposure to structural growth while keeping concentration and refinancing risk under control. European and Greater China equities offer lower headline valuations, but the case for a sustained re-rating requires earnings delivery and a more supportive policy and demand backdrop. Singapore’s income characteristics remain useful, although its strong YTD equity return and the weakness in S-REITs argue for discrimination between individual holdings. The next catalysts are the upcoming corporate results, management guidance on AI investment and monetisation, and evidence that inflation and bond yields are stabilising. Broader earnings participation would improve confidence in the market, although continued high-yield fixed income spread widening or further increases in long-end yields would instead favour stronger balance sheets and a more cautious pace of adding risk.
FIXED INCOME UPDATE
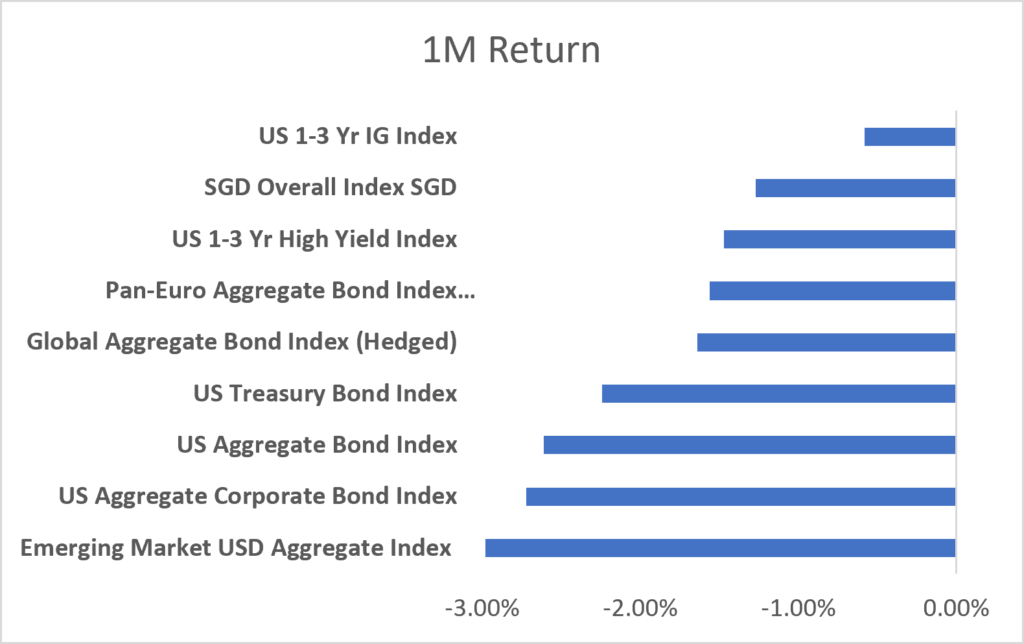 Source: Bloomberg; Returns are presented in USD terms
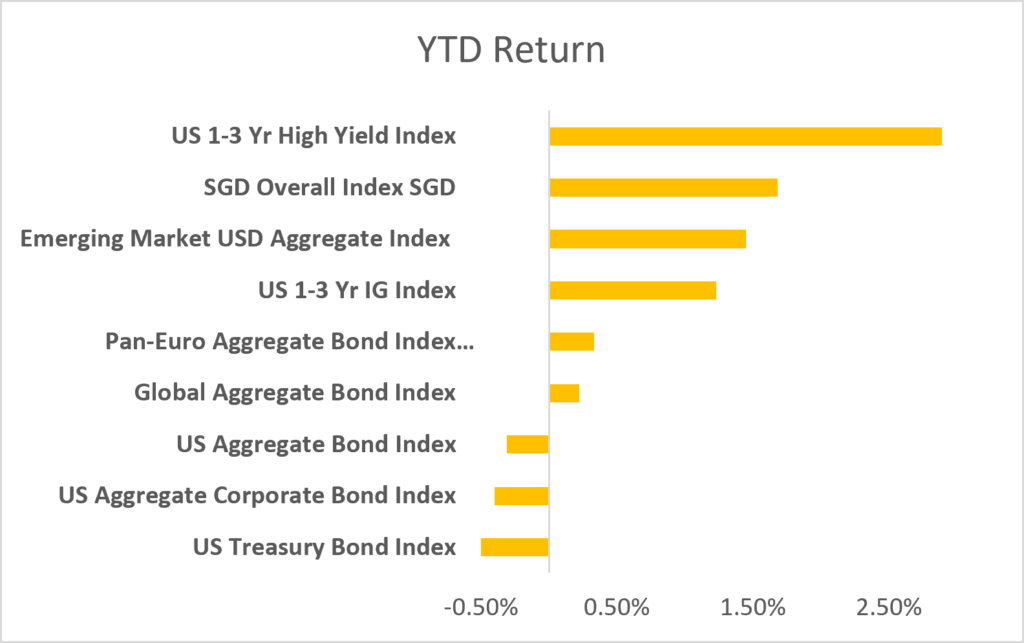
Source: Bloomberg; Returns are presented in USD terms
Global bond markets endured a difficult September as rising sovereign yields and growing concerns over fiscal sustainability triggered a broad-based selloff across fixed income markets. Duration-sensitive sectors bore the brunt of the repricing, with the Emerging Market USD Aggregate Index posting the weakest monthly performance, followed closely by the US Aggregate Corporate Bond Index and broader US Treasury and Aggregate bond benchmarks. Even traditionally defensive assets struggled, with the Global Aggregate and Pan-Euro Aggregate indices also posting negative returns. While short-duration sectors proved relatively more resilient, the US 1–3 Year High Yield and SGD Overall indices still declined, highlighting the breadth of the selloff. Among the indices tracked, the US 1–3 Year Investment Grade Index was the best performer, though it too finished the month modestly in negative territory.
On a year-to-date basis, however, income-oriented and lower-duration sectors continue to dominate the leaderboard. The US 1–3 Year High Yield Index remains the strongest performer with returns exceeding 1.5%, underscoring the advantage of higher income generation and limited duration exposure in a volatile rate environment. The US 1–3 Year Investment Grade Index and SGD Overall Index remain among the better-performing benchmarks, while Emerging Market USD Debt and the Global Aggregate Index have surrendered much of their earlier gains following September’s selloff. By contrast, longer-duration sectors remain firmly in negative territory, with US Treasuries, US Aggregate Corporates and the broader US Aggregate Bond Index continuing to lag as investors demand greater compensation for duration risk.
Bond Vigilantes Go Global
The concerns that emerged in August around fiscal sustainability and rising term premia intensified further in September, with pressure increasingly spreading beyond the United States. While markets initially focused on the sharp rise in U.S. Treasury yields and renewed debate over a potential 5% handle on the 10-year Treasury, investors gradually began to question whether long-term borrowing costs globally had been artificially suppressed by more than a decade of abundant liquidity and central bank intervention. As sovereign debt burdens continue to rise across many developed economies, bond markets increasingly demanded greater compensation for duration risk, triggering another month of broad-based weakness across global fixed income markets.
Attempts by policymakers to stabilise the long end of the U.S. yield curve also met with limited success. Following August’s expansion of Treasury buybacks, which drew comparisons to a modern-day “Operation Twist”, yields briefly retreated before resuming their upward march. Rather than alleviating concerns, the intervention was interpreted by some market participants as evidence of policymakers’ growing unease over rising borrowing costs and deteriorating market liquidity. Investors remained focused on the underlying drivers of the selloff, namely resilient economic growth, persistent inflationary pressures, widening fiscal deficits and an expanding pipeline of sovereign debt issuance. In effect, the market continued to push back against official attempts to anchor long-term yields, reinforcing the broader theme of bond vigilantism.
Perhaps more significantly, signs began to emerge that these concerns were no longer confined to the United States. Attention increasingly shifted towards Europe towards month-end, where long-dated French government bond yields came under pressure amid renewed scrutiny of fiscal dynamics and public debt sustainability. While France remains far removed from any form of funding stress, the sharp market reaction highlighted a broader shift in investor behaviour. The debate is no longer centred solely on the timing of future rate cuts, but rather on the level of long-term yields required to attract capital in a world of persistent inflation, elevated government borrowing requirements and growing sovereign debt burdens. In that respect, September may be remembered as the month bond vigilantes evolved from a U.S. story into a genuinely global phenomenon.
Important Information
This material is provided by Phillip Capital Management (S) Ltd (“PCM”) for general information only and does not constitute a recommendation, an offer to sell, or a solicitation of any offer to invest in any of the exchange-traded fund (“ETF”) or the unit trust (“Products”) mentioned herein. It does not have any regard to your specific investment objectives, financial situation and any of your particular needs. You should read the Prospectus and the accompanying Product Highlights Sheet (“PHS”) for key features, key risks and other important information of the Products and obtain advice from a financial adviser (“FA“) before making a commitment to invest in the Products. In the event that you choose not to obtain advice from a FA, you should assess whether the Products are suitable for you before proceeding to invest. A copy of the Prospectus and PHS are available from PCM, any of its Participating Dealers (“PDs“) for the ETF, or any of its authorised distributors for the unit trust managed by PCM.
An ETF is not like a typical unit trust as the units of the ETF (the “Units“) are to be listed and traded like any share on the Singapore Exchange Securities Trading Limited (“SGX-ST”). Listing on the SGX-ST does not guarantee a liquid market for the Units which may be traded at prices above or below its NAV or may be suspended or delisted. Investors may buy or sell the Units on SGX-ST when it is listed. Investors cannot create or redeem Units directly with PCM and have no rights to request PCM to redeem or purchase their Units. Creation and redemption of Units are through PDs if investors are clients of the PDs, who have no obligation to agree to create or redeem Units on behalf of any investor and may impose terms and conditions in connection with such creation or redemption orders. Please refer to the Prospectus of the ETF for more details.
Investments are subject to investment risks including the possible loss of the principal amount invested, and are not obligations of, deposits in, guaranteed or insured by PCM or any of its subsidiaries, associates, affiliates or PDs. The value of the units and the income accruing to the units may fall or rise. Past performance is not necessarily indicative of the future or likely performance of the Products. There can be no assurance that investment objectives will be achieved. Any use of financial derivative instruments will be for hedging and/or for efficient portfolio management. PCM reserves the discretion to determine if currency exposure should be hedged actively, passively or not at all, in the best interest of the Products. The regular dividend distributions, out of either income and/or capital, are not guaranteed and subject to PCM’s discretion. Past payout yields and payments do not represent future payout yields and payments. Such dividend distributions will reduce the available capital for reinvestment and may result in an immediate decrease in the net asset value (“NAV”) of the Products. Please refer to <www.phillipfunds.com> for more information in relation to the dividend distributions.
The information provided herein may be obtained or compiled from public and/or third party sources that PCM has no reason to believe are unreliable. Any opinion or view herein is an expression of belief of the individual author or the indicated source (as applicable) only. PCM makes no representation or warranty that such information is accurate, complete, verified or should be relied upon as such. The information does not constitute, and should not be used as a substitute for tax, legal or investment advice.
The information herein are not for any person in any jurisdiction or country where such distribution or availability for use would contravene any applicable law or regulation or would subject PCM to any registration or licensing requirement in such jurisdiction or country. The Products is not offered to U.S. Persons. PhillipCapital Group of Companies, including PCM, their affiliates and/or their officers, directors and/or employees may own or have positions in the Products. This advertisement has not been reviewed by the Monetary Authority of Singapore.
