

Market Commentary – June 2026
EQUITY MARKET UPDATE
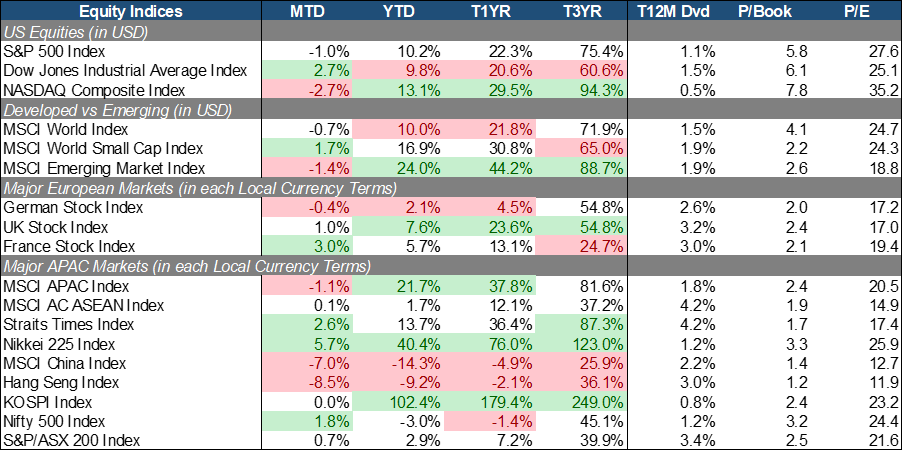
Source: Bloomberg (Total Return in USD/Local Currency terms)
U.S. equities surrendered a portion of their AI-fueled gains as the month split into two distinct halves. Stocks extended their climb into early June on continued AI Capex optimism and a de-escalation in the Iran conflict, with the Strait of Hormuz reopening and oil sliding back toward pre-war levels, but sentiment turned choppy once the Fed’s June FOMC came in more hawkish than markets had priced. The Nasdaq (-2.7% MTD) underperformed both the S&P 500 (-1.0% MTD) and the Dow (+2.7% MTD), a reversal of the growth-over-value dynamic that dominated the first half of 2026. Reports of an OpenAI IPO delay further rattled sentiment around AI monetization timelines, while persistent memory chip shortages, driven by AI workloads absorbing a growing share of global DRAM supply, prompted Apple and Microsoft to announce hardware price increases, adding a fresh inflationary wrinkle even as energy costs eased.
Europe was mixed, with France the standout performer and Germany giving back its earlier gains. French equities (+3.0% MTD) led the region despite lingering fiscal and political noise, helped by the broader risk-on tone following the Iran ceasefire framework and resilient corporate earnings. German equities (-0.4% MTD) cooled after a strong run as some of the industrial and semiconductor-linked optimism faded alongside the global tech pullback. UK equities (+1.0% MTD) posted modest gains, continuing to lag higher-growth markets given limited exposure to AI winners, though that same composition spared the market the sharpest of the tech-driven volatility.
APAC was by far the most volatile region, swinging from record highs to a sharp AI-driven unwind. Japan was the story of the month, with the Nikkei 225 (+5.7% MTD) hitting a string of fresh record highs on a weaker yen, a 10.5 trillion yen of “physical AI” investment plan, and continued strength in semiconductor and robotics names, even as the BoJ hiked rates to 1%, the highest since 1995. In essence, yen weakness kept boosting export earnings even as it raised intervention risk. South Korea’s KOSPI finished essentially flat, masking a wild ride underneath as heavily leveraged AI and chip positions unwound sharply late in the month, plunging as much as 9% in a single session and triggering trading halts before stabilizing. China/HK (-7.0%/-8.5% MTD) were the clear regional laggards under the weight of soft Chinese retail data, ongoing structural slump of the property sector, and direct exposure to the broader AI/tech selloff. ASEAN markets (+0.1% MTD) were aggregately flat, caught between the regional tech drawdown and support from easing oil prices given the bloc’s energy-import sensitivity.
Overall, a hawkish Fed under new Chair Warsh and mounting questions about AI monetization after an extraordinary run drove nearly every regional divergence in June. Markets with the heaviest, most leveraged AI exposure took the hit, while markets with more balanced or defensive compositions such as Japan and Singapore (+2.6% MTD) held up better.
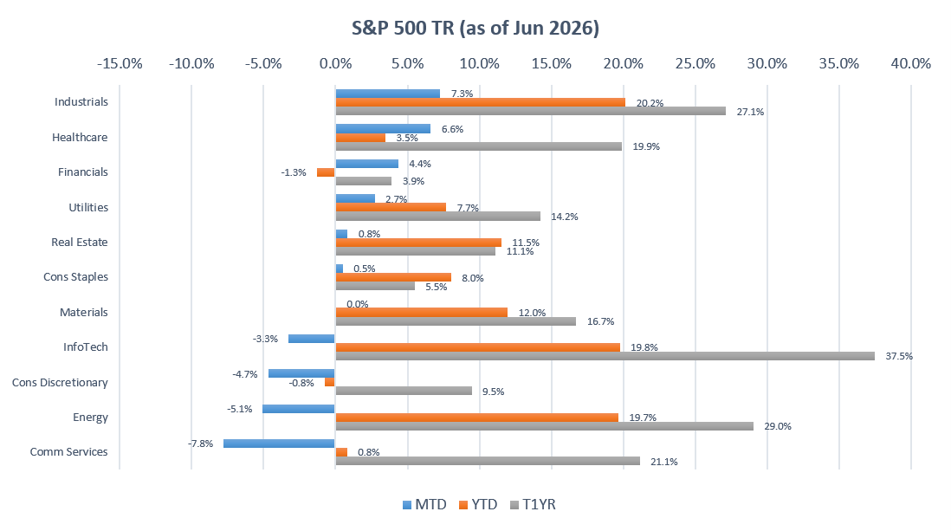 Source: Bloomberg (Total Return in USD terms)
June marked a clean reversal of the growth-wins/defensives-lag pattern that had defined the year, with Defensives as a group (+3.3% MTD) outperforming Cyclicals (+0.1%) and Sensitives (-2.2%) for the first time in months.
At the sector level, Industrials (+7.3% MTD), Healthcare (+6.6% MTD), and Financials (+4.4% MTD) led. Industrials outperformed by a wide margin, benefiting from AI buildout demand for heavy electrical equipment, cooling systems, and backup power infrastructure, while also serving as a natural landing spot for capital rotating out of crowded growth trades. Healthcare finally broke its year-long slump as investors leaned into large-cap pharma and medtech on a defensive rotation for steadier earnings profile and lighter valuations. Financials rose as a steeper yield curve and diminished odds of near-term rate cuts supported net interest margins, even as some investors flagged the new leadership itself as a source of policy uncertainty.
On the other end, Communication Services (-7.8% MTD), Energy (-5.1% MTD), Consumer Discretionary (-4.7% MTD), and Information Technology (-3.3% MTD) lagged. Comm Services and Info Tech were hit hardest on renewed doubts about AI monetization, with the OpenAI IPO delay rattling sentiment across the mega-cap internet and tech names. Energy fell as markets quickly normalized the conflict once the Iran ceasefire briefly reopened the Strait of Hormuz, with record non-OPEC+ production from the U.S. further neutralizing supply disruption fears. Consumer Discretionary lagged as investors repriced for a higher-for-longer rate environment weighing on rate-sensitive consumer names even as labour data and wage growth remained broadly resilient.
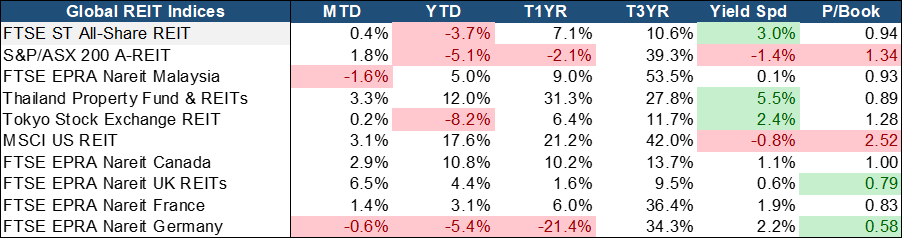
Source: Bloomberg (Total Return in Local Currency terms)
Global REIT markets found broad support in June as the rotation into value and defensives that lifted equity sectors like Industrials and Financials also flowed into income-oriented property names, even as rising rates across most of the developed world created cross currents. UK REITs (+6.5% MTD) stood out globally. US (+3.1% MTD) also advanced despite the back-up in Treasury yields, benefiting from the same rotation out of crowded AI/growth trades. Meanwhile, Malaysia (-1.6% MTD) and Canada (-0.6% MTD) relatively underperformed. Asian REIT markets were more muted, though notably resilient given the regional backdrop.
The investment case for S-REITs (+0.4% MTD) remains attractive on a relative basis. The sector trades at ~0.94x Price-to-Book, still a meaningful discount to underlying asset values, while offering a 5.0% dividend yield and a 3.0% yield spread, keeping it among the more compelling income propositions in developed REIT markets, even as June’s own gain (+0.4% MTD) was modest relative to peers. Fundamentals across key subsectors remain resilient. Industrial S-REITs continue to benefit from logistics modernization, e-commerce penetration, and accelerating AI-linked DC demand, while Retail REITs deliver healthy rental reversions on resilient consumer spending and limited new supply. Balance sheets remain well-managed, with gearing stable and debt maturities well-laddered heading into a higher-for-longer rate environment.
EQUITY MARKET OUTLOOK
Rates Backdrop and Market Sentiment:
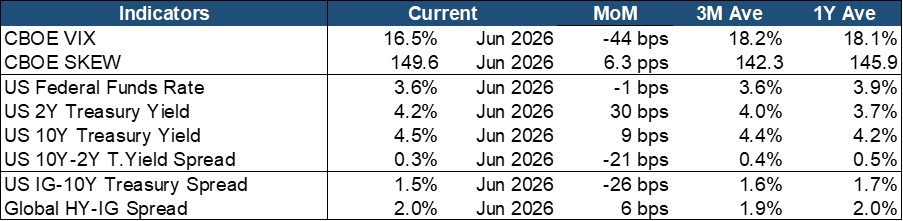
Source: Bloomberg.
Volatility eased on the surface, though skew told a more cautious story underneath. The VIX slipped further to 16.5% (-44 bps MoM), comfortably below both its 3-month (18.2%) and 1-year (18.1%) averages, though volatility spiked mid-to-late June as the Nasdaq strung together five straight losing sessions before subsiding again by month-end as the Iran ceasefire held. The SKEW index rose meaningfully to 149.6 (+6.3 pts), moving back above the trailing trendlines, and that combination of low realized volatility alongside rising tail-risk pricing suggests investors came out of June’s AI/rate scare more inclined to keep some downside protection on, even as day-to-day price action calmed.
Treasury yields moved higher across the curve as the Fed’s new leadership signaled a genuinely hawkish stance. The Fed held the funds rate at 3.6% for a third straight month, but Kevin Warsh’s first meeting as Chair came across as more hawkish than priced, and short-end yields reacted accordingly, with the 2Y jumping 30 bps to 4.2%, well above its long-term average, while the 10Y rose a more modest 9 bps to 4.5%. That asymmetric move drove further bear-flattening, narrowing the 10Y-2Y spread by 21 bps to just 0.3%, the tightest level in over a year, consistent with markets pricing a Fed that stays restrictive for longer, potentially even hiking, rather than easing into a slowdown.
Credit markets sent a more mixed signal than equities and rates. The IG-Treasury spread kept tightening (-26 bps to 1.5%, below trailing averages), suggesting corporate balance-sheet confidence held up fine through the volatility. The Global HY-IG spread, however, widened 6 bps to 2.0%, a modest but notable divergence and the first sign in a while of investors demanding a bit more compensation for lower-quality credit risk, a small crack worth watching should the AI-monetization skepticism that hit growth stocks in June begin bleeding into weaker balance sheets.
Macroeconomic Trends and Signals:
Source: Bloomberg.
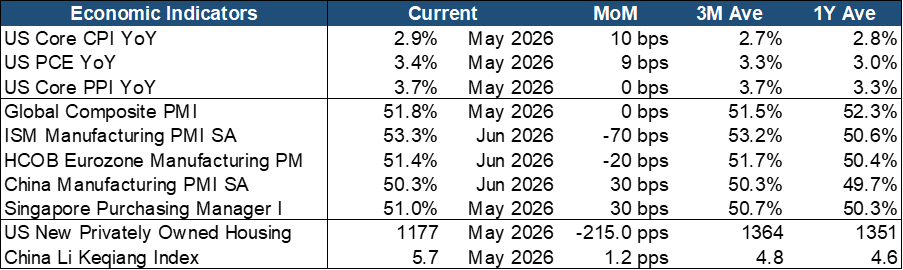
Inflation kept reaccelerating, giving the hawkish Fed pivot real justification. Core CPI ticked up to 2.9% YoY (+10 bps), slightly above its 1Y trend, while PCE inflation, the Fed’s preferred gauge, rose to 3.4% YoY, trending further from its 2% target. Core PPI held flat at 3.7%, still well above its 1-year average and indicating pipeline cost pressures have not meaningfully eased even as the worst of the oil-driven inflation shock from the Iran conflict has started to fade with the ceasefire.
Global manufacturing activities stayed in expansion territory but lost some momentum. The OECD composite leading indicators for both the U.S. (129.7) and the world (124.3) continued trending above their 1Y averages, so the underlying growth backdrop still looks resilient even as inflation complicates the policy path.
Taken together, resilient activity data and improving leading indicators argue against recession risk, but reaccelerating CPI and PCE alongside a hawkish new Fed chair have pushed out the timeline for easing and pushed up both ends of the yield curve, and the rise in SKEW alongside the modest widening in HY spreads suggests markets aren’t fully dismissing the possibility that sticky inflation, a hawkish Fed, and stretched AI valuations could produce more volatility ahead, even with the VIX itself sitting near multi-month lows.
Outlook: From Energy Shock to AI Reckoning – A Bull Case Stress-Tested, Not Broken
The Iran conflict that dominated May’s narrative closed with the ceasefire holding and oil giving back most of its war premium, news that should have been unambiguously good for equities. Instead, the market used the reprieve to interrogate the AI monetization thesis it had been running on all year. Rather than a broad-based selloff, capital rotated to less crowded growth sectors and defensives, suggesting investors are recalibrating AI expectations rather than abandoning them outright. Still, the fact that a single headline about OpenAI’s IPO timeline could trigger a 5% single-session drop in South Korea’s KOSPI is a reminder of just how fragile and leveraged the AI supply-chain trade has become beneath the surface.
Geopolitics has de-escalated, but it has left behind a genuinely hawkish Fed that isn’t rushing to declare victory over inflation. The jump of 30 bps in the 2Y yield against a backdrop of falling oil prices is the signature of a policy-driven repricing rather than a geopolitical one, and with inflation reaccelerating in June, the Fed has yet to see the disinflation case it needs to pivot dovish. The stark divergence between depressed consumer sentiment and resilient labour and spending data also deserves close attention. Such gaps have historically resolved through a correction in one direction, and the market has yet to settle which way this one breaks.
The bull case survived June, but it has now been stress-tested rather than simply asserted, and positioning should reflect that shift. AI monetization risk isn’t going away, and it shouldn’t. AI hardware earnings have continued to beat expectations, but Hyperscaler Capex is now large and concentrated enough that markets need proof of returns on a shorter timeline than a year ago, and every quarter that proof fails to arrive more convincingly should compress the multiple investors are willing to pay for exposure rather than earnings. That doesn’t mean the trade is over, only that its easy phase is. Credit is beginning to echo this caution. IG spreads kept tightening in June, but the slight widening in HY spreads is the first hint of a two-speed market, one comfortable with high-quality balance sheets but growing skeptical of leveraged credit, a gap worth watching as a potential leading indicator for equity stress.
Against this backdrop, the investment thesis is still intact for staying invested in the AI theme while growing more selective about where in the chain exposure is held, tilting toward names with earnings already visible in the numbers, over names still trading primarily on narrative and multiple expansion. We also see merit in keeping some tail-risk hedges on even as the VIX fell, mostly for a scenario June delivered a preview of – A sharp, narrow, AI-led drawdown that doesn’t show up in broad volatility until it’s already underway. The next real catalyst is less likely to be geopolitical, as that risk has genuinely receded, and more likely to be either a hotter-than-expected CPI print forcing the Fed’s hand or a Hyperscalers’ earnings or guidance miss that will again test the AI monetization thesis.
FIXED INCOME UPDATE
 Source: Bloomberg; Returns are presented in USD terms
Source: Bloomberg; Returns are presented in USD terms
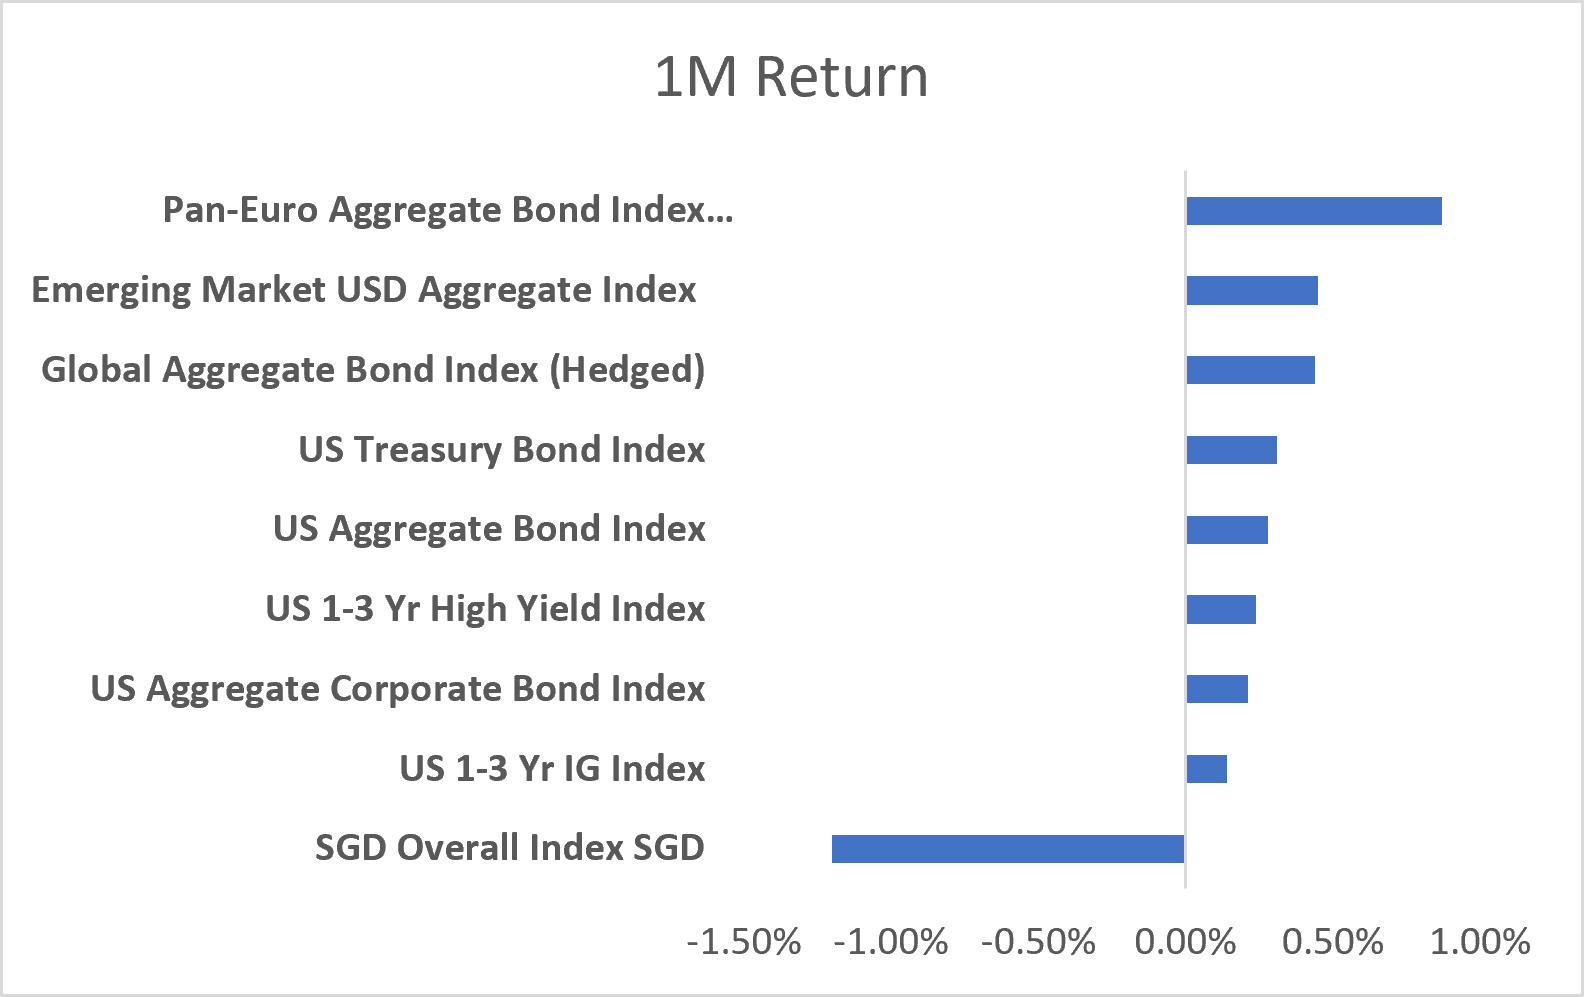
Global bond markets posted broadly positive returns in June, with most major fixed income sectors delivering gains despite ongoing uncertainty over the interest rate outlook. The Pan-European Aggregate Bond Index was the standout performer, returning approximately +0.9% for the month, while Emerging Market USD Debt and the Global Aggregate Bond Index also recorded solid gains. In the US, Treasury bonds outperformed credit markets, with the US Treasury and US Aggregate Bond Indices returning around +0.3%, while investment grade and high yield credit delivered more modest advances. Meanwhile, the SGD Overall Index was the only benchmark in our universe to post a negative monthly return, declining 1.2% in USD terms as a stronger US dollar weighed on returns.
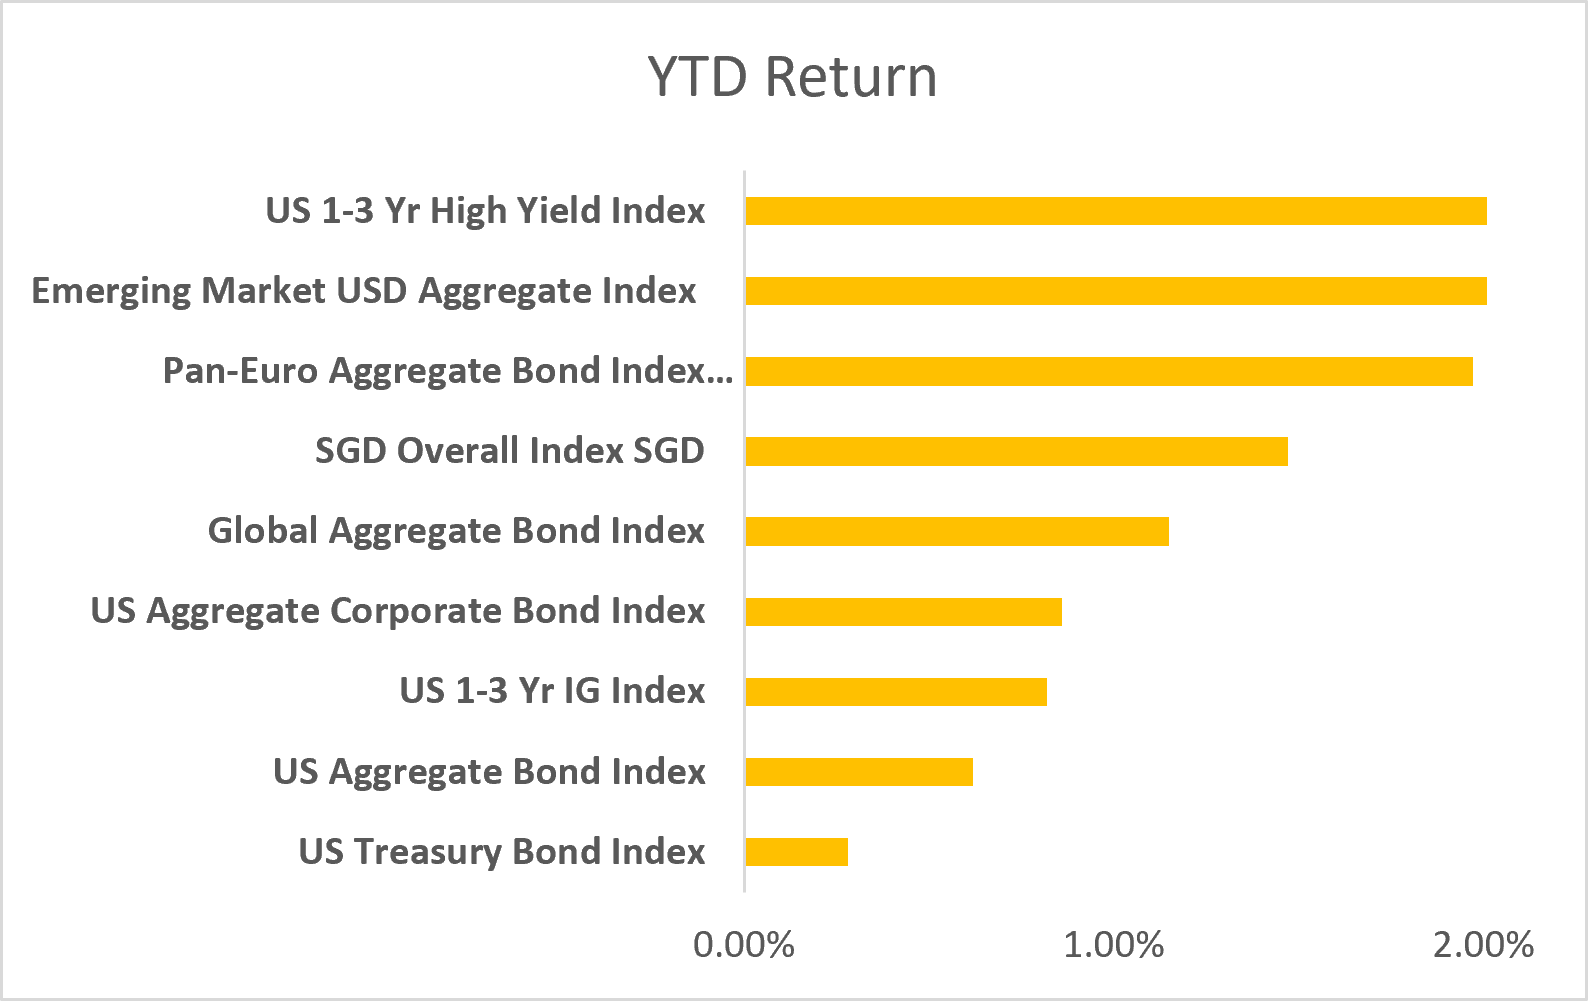
Year-to-date, carry-oriented sectors continue to dominate the leaderboard, with Emerging Market USD Debt and the US 1–3 Year High Yield Index each returning approximately +2.0%. European bonds have also enjoyed a strong first half of the year, with the Pan-European Aggregate Bond Index up nearly +2.0%, while the SGD Overall Index remains among the stronger-performing developed market benchmarks despite June’s setback. At the other end of the spectrum, US Treasuries remain the weakest performer year-to-date, reflecting the more challenging environment for duration amid ongoing uncertainty over the path of US interest rates.
Monetary Policy Divergence Takes Centre Stage
A key theme that emerged in June was the growing divergence in monetary policy across major economies. The European Central Bank raised interest rates for the first time since 2023 as policymakers sought to counter renewed inflationary pressures stemming from higher energy prices, while the Bank of Japan continued its policy normalisation journey with a rate hike to 1.0%, its highest policy rate in more than three decades. In contrast, the US Federal Reserve left interest rates unchanged under newly appointed Chair Kevin Warsh, although the tone of the June meeting was widely perceived as hawkish as the Fed placed greater emphasis on inflation-fighting credibility and reduced its reliance on forward guidance.
For bond investors, these differing policy trajectories have important implications. Diverging interest rate paths influence relative bond valuations, cross-border capital flows and currency movements, often creating opportunities beyond simply taking duration risk. The contrasting performance seen across global bond markets this year reflects this dynamic, with investors increasingly favouring regions and sectors that offer attractive carry while remaining resilient to policy uncertainty. As central banks move at different speeds and for different reasons, fixed income returns are likely to be driven as much by relative value opportunities as by the overall direction of interest rates.
The clearest manifestation of this divergence can be seen in currency markets. Despite the Bank of Japan’s latest rate hike, the Japanese yen weakened to its lowest level against the US dollar in nearly four decades, highlighting how relative yield differentials continue to dominate investor behaviour. The persistence of higher US interest rates has sustained demand for dollar-denominated assets and reinforced the attractiveness of yen-funded carry trades. For global fixed income investors, this serves as a reminder that currency movements remain an important component of total returns, with changes in foreign exchange markets capable of amplifying or offsetting gains generated by underlying bond portfolios.
Important Information
This material is provided by Phillip Capital Management (S) Ltd (“PCM”) for general information only and does not constitute a recommendation, an offer to sell, or a solicitation of any offer to invest in any of the exchange-traded fund (“ETF”) or the unit trust (“Products”) mentioned herein. It does not have any regard to your specific investment objectives, financial situation and any of your particular needs. You should read the Prospectus and the accompanying Product Highlights Sheet (“PHS”) for key features, key risks and other important information of the Products and obtain advice from a financial adviser (“FA“) before making a commitment to invest in the Products. In the event that you choose not to obtain advice from a FA, you should assess whether the Products are suitable for you before proceeding to invest. A copy of the Prospectus and PHS are available from PCM, any of its Participating Dealers (“PDs“) for the ETF, or any of its authorised distributors for the unit trust managed by PCM.
An ETF is not like a typical unit trust as the units of the ETF (the “Units“) are to be listed and traded like any share on the Singapore Exchange Securities Trading Limited (“SGX-ST”). Listing on the SGX-ST does not guarantee a liquid market for the Units which may be traded at prices above or below its NAV or may be suspended or delisted. Investors may buy or sell the Units on SGX-ST when it is listed. Investors cannot create or redeem Units directly with PCM and have no rights to request PCM to redeem or purchase their Units. Creation and redemption of Units are through PDs if investors are clients of the PDs, who have no obligation to agree to create or redeem Units on behalf of any investor and may impose terms and conditions in connection with such creation or redemption orders. Please refer to the Prospectus of the ETF for more details.
Investments are subject to investment risks including the possible loss of the principal amount invested, and are not obligations of, deposits in, guaranteed or insured by PCM or any of its subsidiaries, associates, affiliates or PDs. The value of the units and the income accruing to the units may fall or rise. Past performance is not necessarily indicative of the future or likely performance of the Products. There can be no assurance that investment objectives will be achieved. Any use of financial derivative instruments will be for hedging and/or for efficient portfolio management. PCM reserves the discretion to determine if currency exposure should be hedged actively, passively or not at all, in the best interest of the Products. The regular dividend distributions, out of either income and/or capital, are not guaranteed and subject to PCM’s discretion. Past payout yields and payments do not represent future payout yields and payments. Such dividend distributions will reduce the available capital for reinvestment and may result in an immediate decrease in the net asset value (“NAV”) of the Products. Please refer to <www.phillipfunds.com> for more information in relation to the dividend distributions.
The information provided herein may be obtained or compiled from public and/or third party sources that PCM has no reason to believe are unreliable. Any opinion or view herein is an expression of belief of the individual author or the indicated source (as applicable) only. PCM makes no representation or warranty that such information is accurate, complete, verified or should be relied upon as such. The information does not constitute, and should not be used as a substitute for tax, legal or investment advice.
The information herein are not for any person in any jurisdiction or country where such distribution or availability for use would contravene any applicable law or regulation or would subject PCM to any registration or licensing requirement in such jurisdiction or country. The Products is not offered to U.S. Persons. PhillipCapital Group of Companies, including PCM, their affiliates and/or their officers, directors and/or employees may own or have positions in the Products. This advertisement has not been reviewed by the Monetary Authority of Singapore.
