

Market Commentary – July 2026
EQUITY MARKET UPDATE
Source: Bloomberg (Total Return in USD/Local Currency terms)
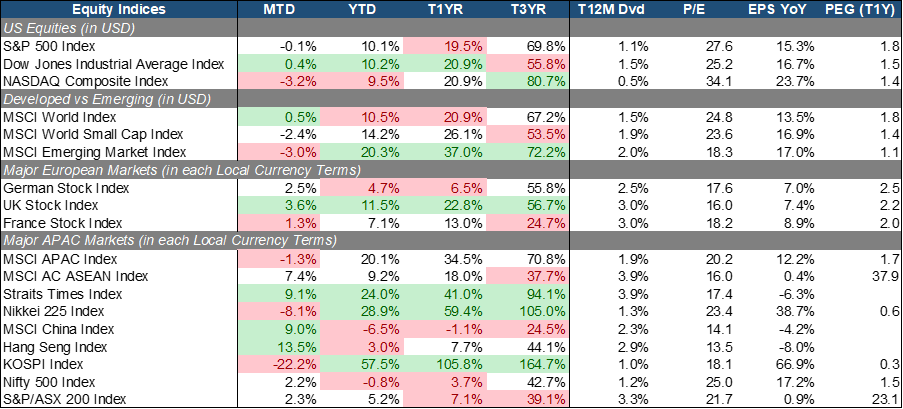
U.S. equities were flat aggregately while the AI complex came apart underneath. The S&P 500 finished essentially unchanged (-0.1% MTD) and the Dow edged higher (+0.4% MTD), but the Nasdaq fell for a second straight month (-3.2% MTD) as the AI monetization skepticism that surfaced in June hardened into active de-risking. The macro backdrop improved on both counts that matter, with inflation falling and an accelerating manufacturing activity, yet the long end of the curve sold off regardless. In short, growth was fine and inflation was cooling. What was repriced was the multiples investors were willing to pay for AI narrative rather than AI earnings.
Europe was the quiet winner, with all three major markets advancing. UK equities (+3.6% MTD) led, as the market’s light exposure to AI winners, a handicap for most of 2026, turned into an asset once capital began rotating out of crowded chips and Hyperscaler-linked trades. German equities (+2.5% MTD) more than recovered June’s decline, supported by a further manufacturing expansion and by the index’s industrial and value tilt. French equities (+1.3% MTD) extended their gains more modestly after leading the region in June. Valuation remains the region’s underappreciated support, with the DAX (17.6x), CAC (18.2x), and UKX (16.0x) all trading above their 10-year averages but nowhere near the stretched territory occupied by the S&P 500.
APAC produced by far the widest dispersion of any region, effectively splitting into an AI complex that broke and a value complex that re-rated. South Korea’s KOSPI (-22.2% MTD) was the epicenter, unwinding the leveraged chip and AI positioning that had built through the first half and that still leaves the index up 57.5% YTD even after July’s collapse. Japan followed, with the Nikkei 225 (-8.1% MTD) surrendering a large part of its record run as the semiconductor and robotics names that drove June’s rally reversed. On the other side, China and Hong Kong (+9.0%/+13.5% MTD) were the strongest markets globally, re-rating off deeply discounted valuations and a year of underperformance, despite a manufacturing PMI that slipped back into contraction and a falling Li Keqiang Index, making this a positioning and policy-expectation rally rather than one grounded in activity data. ASEAN (+7.4% MTD) and Singapore (+9.1% MTD) also had exceptional months, with the STI steadily climbing up to 24.0% YTD, on the back of its defensive, income-heavy composition.
 Source: Bloomberg (Total Return in USD terms)
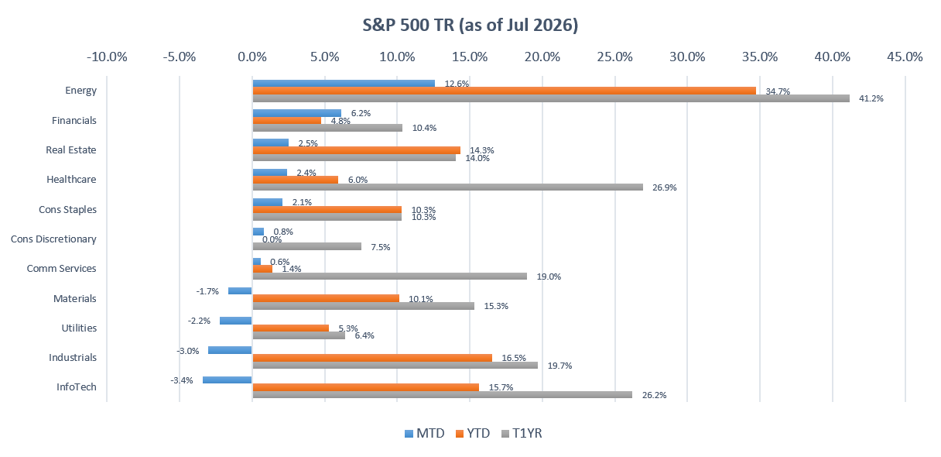
July extended June’s rotation but changed its winner, with Cyclicals as a group (+2.0% MTD) outperforming Sensitives (+1.7%) and Defensives (+0.8%), and all three style groups finishing positive even as the index itself was flat. At the sector level, Energy (+12.6% MTD), Financials (+6.2% MTD), Real Estate (+2.5% MTD), and Healthcare (+2.4% MTD) led. Energy outperformed by a wide margin and now sits +34.7% YTD, rallying as the post-ceasefire complacency in crude unwound and as markets began pricing the power and fuel intensity of the AI buildout into upstream and midstream earnings rather than only into equipment makers. Financials extended June’s gains on a curve that bear-steepened rather than flattened, a considerably more constructive shape for net interest margins. Real Estate and Healthcare both benefited from the continued rotation into income and defensive earnings.
On the other end, InfoTech (-3.4% MTD), Industrials (-3.0% MTD), Utilities (-2.2% MTD), and Materials (-1.7% MTD) lagged. InfoTech extended its slide as the AI trades stress test moved from a sentiment overhang to an active positioning decision, though the sector still carries room for further multiple compression. Industrials gave back all of June’s outperformance, a reversal sharp enough to suggest that June’s gain was itself rotation-driven rather than a durable re-rating of the AI infrastructure trade. Utilities fell despite the defensive bid elsewhere, weighed down by the rise in yield, while Materials slipped on softening Chinese activity data.
Source: Bloomberg (Total Return in Local Currency terms)
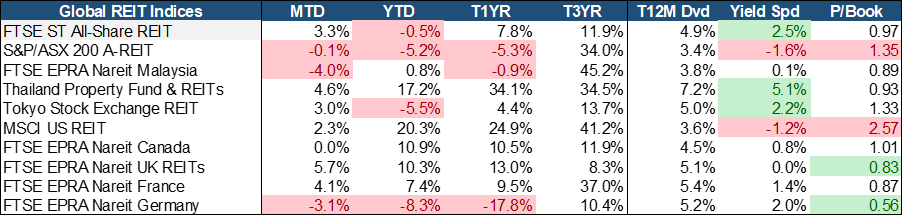
Global REIT markets extended June’s gains despite a meaningfully higher long end, as the rotation into income and value more than offset the rise in long-term yield. UK REITs (+5.7% MTD) led globally for a second consecutive month, with Thailand (+4.6% MTD) and France (+4.1% MTD) also posting strong gains. US REITs (+2.3% MTD) advanced again and now lead the group at +20.3% YTD, benefiting from the same rotation out of crowded AI/growth trades. Japan (+3.0% MTD) rebounded, while Germany (-3.1% MTD) and Malaysia (-4.0% MTD) were the clear laggards. That REITs rallied into rising long-end yields is itself informative, as the bid was for the income characteristic rather than for a duration trade.
The investment case for S-REITs (+3.3% MTD) strengthened in July, with the sector delivering its strongest month of the year while still trading below book. The sector trades at ~0.97x Price-to-Book, still a discount to underlying asset values, while offering a 4.9% dividend yield and a 2.5% yield spread. Fundamentals across key subsectors remain resilient. Industrial S-REITs continue to benefit from logistics modernization, e-commerce penetration, and accelerating AI-linked DC demand, while Retail REITs deliver healthy rental reversions on resilient consumer spending and limited new supply. Balance sheets remain well-managed, with gearing stable and debt maturities well-laddered, though a further back-up in long-end yields is now the clearest risk to the sector’s relative valuation case.
EQUITY MARKET OUTLOOK
Rates Backdrop and Market Sentiment:
Source: Bloomberg.
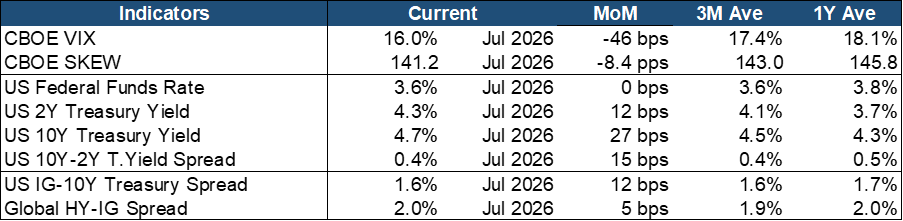
Volatility signals turned complacent even as the market beneath them fractured. The VIX slipped further to 16.0% (-46 bps MoM), below both its 3-month (17.4%) and 1-year (18.1%) averages, while the SKEW index fell 8.4 points to 141.2, back below both trailing averages after June’s spike. That combination is striking, because in a month that delivered a 22% drawdown in a major developed market and a second consecutive monthly loss for Nasdaq, investors reduced rather than increased their tail-risk protection. The most plausible reading is that the AI unwind was treated as a contained, positioning-driven event rather than a systemic one. It also means the market carries less downside insurance into August than it did entering July, at precisely the point where dispersion is at its widest.
Treasury yields rose again, but the shape of the move inverted June’s. The Fed held the funds rate at 3.6% for a fourth consecutive month, and with inflation cooling sharply the front end barely moved, the 2Y rising just 12 bps to 4.3%. The long end did the work, with the 10Y up 27 bps to 4.7%, well above its 1-year average of 4.3%. That bear-steepening widened the 10Y-2Y spread by 15 bps to 0.4%, reversing June’s compression to a one-year low. A curve that steepens from the back end while inflation prints are falling is not a Fed-expectations story. It points to term premium, some combination of issuance, softer foreign demand, and diminished conviction that the long end deserves to trade this close to the policy rate.
Credit widened on both measures for the first time in months, and that deserves more attention than the levels themselves suggest. The IG-Treasury spread reversed its tightening trend, widening 12 bps to 1.6%, while the Global HY-IG spread widened a further 5 bps to 2.0%, now above its 1-year average. June’s HY widening could reasonably be dismissed as noise while IG was still tightening, however, July’s simultaneous move in both cannot. The magnitudes remain small and neither series is anywhere near stress levels, but this is precisely the sequence one would expect if a test on AI trades that hit equity multiples in June and July were beginning to be priced into the debt funding the buildout.
Macroeconomic Trends and Signals:
Source: Bloomberg.
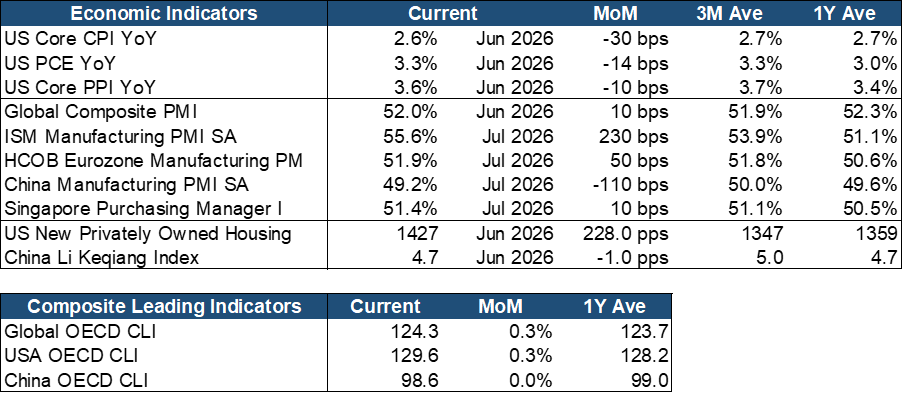
Inflation cooled decisively, finally delivering the disinflation the Fed had been waiting for. Headline CPI fell to 3.5% YoY (-70 bps) and Core CPI eased to 2.6% YoY (-30 bps), now below its 1-year average of 2.7%. PCE inflation, the Fed’s preferred gauge, fell to 3.3% YoY (-13.5 bps), reversing June’s move away from target, while headline PPI collapsed to 6.7% YoY from 8.8% and Core PPI eased to 3.6%. A meaningful part of this is the mechanical unwind of the oil-driven shock from the Iran conflict now fully flowing through, but the breadth of the improvement across core measures suggests the disinflation is not purely an energy base effect.
Global activity accelerated rather than softened, which is the more important half of the story. ISM Manufacturing jumped to 55.6 from 53.3, well above its 1-year average of 51.1, while the Eurozone manufacturing PMI advanced to 51.9 and the global composite PMI held at 52.0. OECD composite leading indicators for both the U.S. (129.6) and the world (124.3) continued trending above their 1Y averages. The clear exception was China, where the manufacturing PMI slipped back into contraction at 49.2 and the Li Keqiang Index fell sharply to 4.74 from 5.73, a divergence worth noting against the strength of Chinese equity markets in the same month.
Taken together, July delivered a genuinely favorable macro combination of falling inflation, accelerating activity, and no recession signal in any leading indicator, and equity markets still went nowhere at the index level. That tells us the binding constraint on returns is no longer macro. It is valuation and concentration on a single theme, and July was the month the market began resolving that constraint by moving money rather than by selling everything. The two signals that did deteriorate, long-end yields and credit spreads, are also the two that will matter most if the AI unwind ever moved from a positioning problem to a funding one.
Outlook: The Rotation Trade – Good Macro, Crowded Positioning, Widening Dispersion
June’s question became July’s answer. The AI monetization skepticism that surfaced as a wobble in June was resolved in July not through a broad market decline but through a violent reallocation of capital, and the scale of the moves is without precedent in this cycle: a 22% drawdown in Korea, an 8% fall in Japan, a 13% gain in Hong Kong and a 9% gain in Singapore, all in a month where the S&P 500 finished flat. This is what the unwind of a crowded, leveraged, geographically concentrated trade looks like when the underlying macro is healthy. The money does not leave the market, it changes address. That distinction matters for positioning, because it argues for reducing concentration rather than reducing equity exposure.
The macro case for equities improved in July on essentially every measure we track. Inflation fell across the board while manufacturing activity accelerated with leading indicators stayed above trend and the Fed is now closer to being able to cut than at any point this year, having held for a fourth consecutive month while inflation moved toward target. Against that backdrop the sell-off in the long end is the discordant note. A rise in the US 10Y in a month of falling inflation prints is a term-premium move, and term premium is the one variable that pressures long-duration growth equities and income sectors simultaneously. Whether it persists into August matters, because a curve that keeps steepening from the back end will eventually cap the rotation into REITs and Utilities that have been absorbing the flows out of technology.
The AI trade is not over, but its geography and its leverage have both been reset. Korea and Japan absorbed the losses because that is where positioning was most crowded and most levered, not because the semiconductor cycle turned. AI hardware earnings have continued to hold up, and InfoTech is still up 15.7% YTD even after two consecutive down months. What has changed is that investors are no longer willing to pay a premium multiple for exposure to the theme without visible earnings attached to it. Credit is starting to agree, and the simultaneous widening in IG and HY spreads in July is the first time both have moved together, which deserves to be watched as a leading indicator rather than dismissed as noise.
Against this backdrop, staying invested in the AI theme remains the right call, but the case for holding it through more diversified geographies and further down the value chain has strengthened materially. The strength in Energy, Financials, and the ASEAN and Greater China markets is not a defensive rotation; it is capital finding cheaper exposure to the same secular demand. We are also less comfortable than in June with the level of protection embedded in the market, with both the VIX and SKEW now below their trailing averages after a month that delivered a 22% single-market drawdown and would keep tail-risk hedges on despite their falling cost. The next real catalyst is most likely to be a Hyperscaler earnings or guidance print that either validates or breaks the monetization case, or a further back-up in long-end yields that forces the market to reprice growth and income at the same time.
FIXED INCOME UPDATE
 Source: Bloomberg; Returns are presented in USD terms
Source: Bloomberg; Returns are presented in USD terms
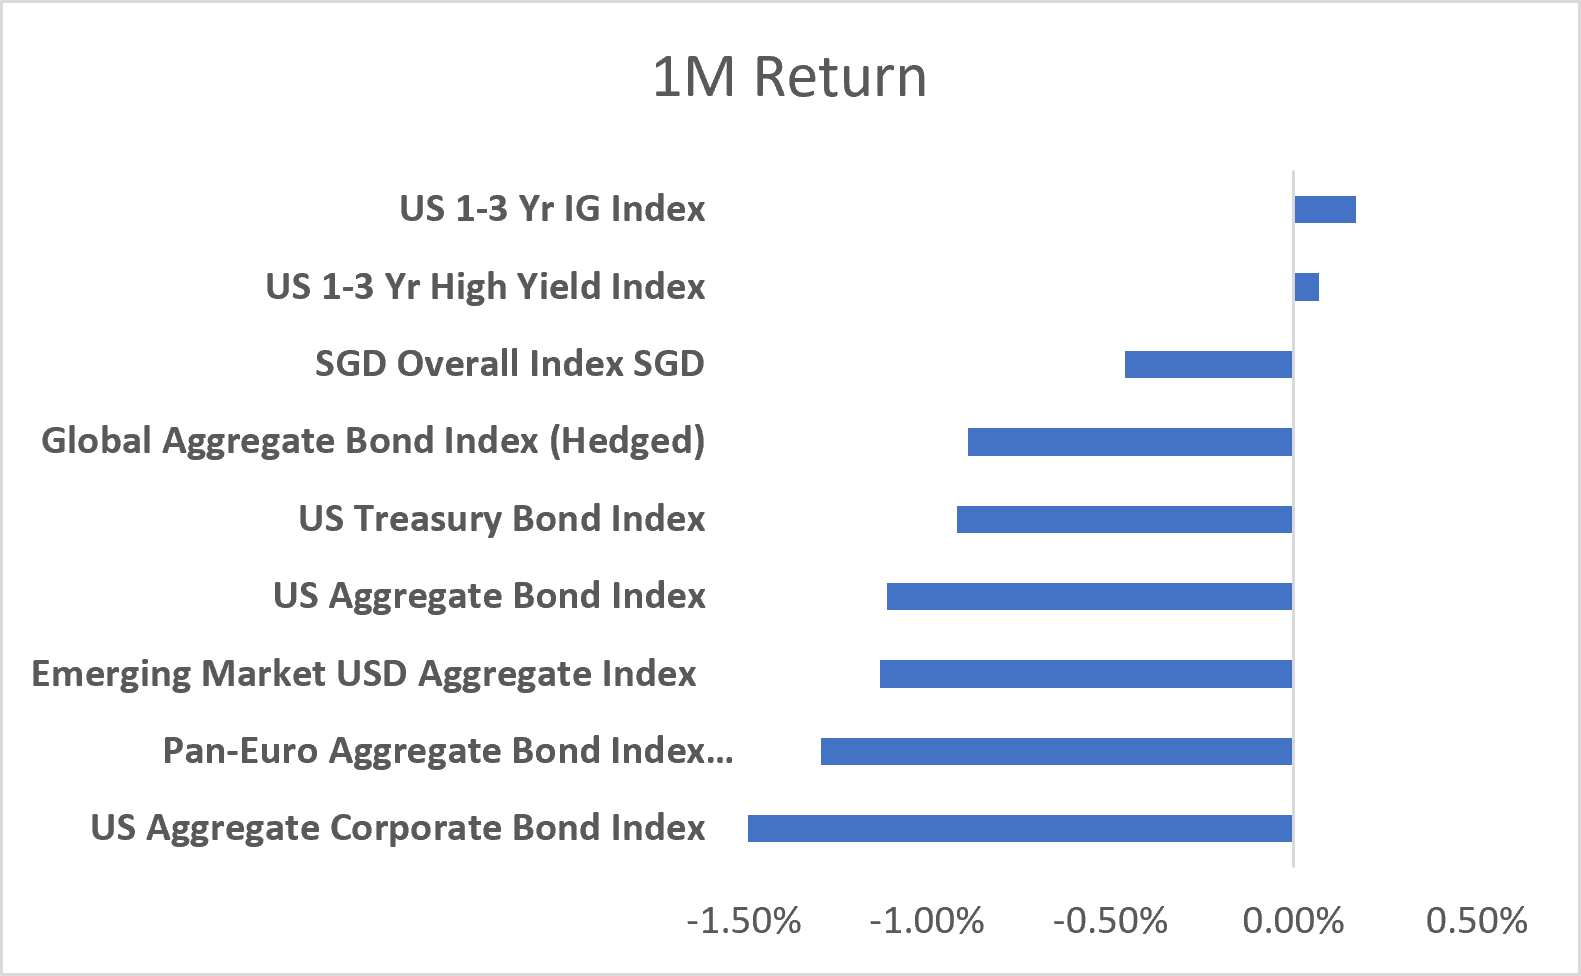
Global bonds endured a difficult July as long‑end US Treasury yields rose sharply, driven by renewed energy volatility from the Iran war. Oil prices spiked mid‑month, reigniting inflation fears and pushing yields higher across the curve, with the long end bearing the brunt. This repricing hit global benchmarks broadly: the US Aggregate Corporate Bond Index was the weakest performer, slipping by more than –1%, while the Pan‑Euro Aggregate and Emerging Market USD Aggregate also posted losses. The SGD Overall Index declined again, pressured both by global yield spillovers and the strong USD translation effect. Notably, MAS did tighten policy slightly by increasing the slope of the S$NEER band, reinforcing its inflation‑control stance, though the width and center of the band were left unchanged. The only bright spots were short‑dated indices such as the US 1–3 Year IG and US 1–3 Year High Yield which eked out slight gains, underscoring their defensive appeal in a rising‑yield environment.
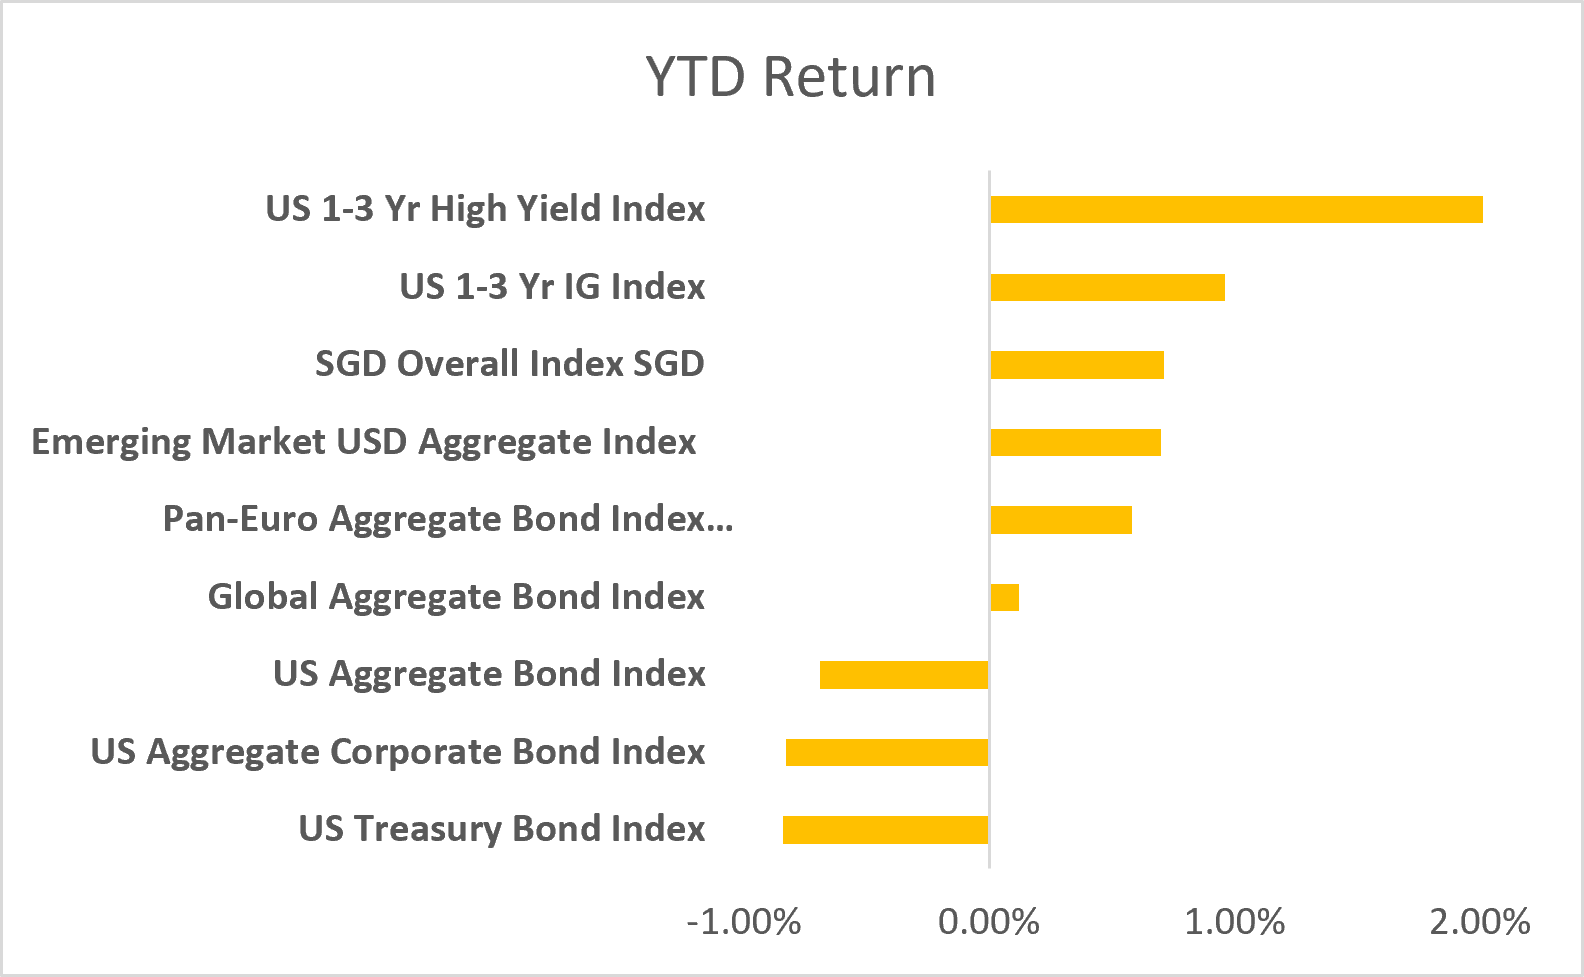
On a year‑to‑date basis, however, the scoreboard still shows resilience. The US 1–3 Year High Yield Index remains the leader, approaching +2% YTD, highlighting the steady carry advantage of short‑duration high yield. The US 1–3 Year IG Index follows closely, also in positive territory, while the Emerging Market USD Aggregate and Pan‑Euro Aggregate continue to hold respectable gains despite July’s setback. The SGD Overall Index, though dented in recent months, remains positive YTD, reflecting Singapore’s credit strength over the longer horizon. By contrast, the US Treasury Index continues to lag, weighed down by persistent inflation expectations and fiscal supply pressures, while the Global Aggregate has delivered only marginal gains.
Cracks in the US Credit Façade
The Fed’s credibility gap was the headline driver in July, but beneath that, dysfunction in the high‑grade bond market and the AI debt binge added layers of fragility. Warsh’s reluctance to act despite inflation persistence left investors demanding higher compensation for long‑duration Treasuries, steepening the curve. Yet the sell‑off was compounded by signs that the plumbing of the bond market itself is under strain. The New York Fed noted rising dysfunction in high‑grade trading, with liquidity thinning and price discovery faltering which is a worrying development at a time when issuance remains heavy.
At the same time, Bloomberg highlighted how hyperscalers are pushing debt markets to their limits. More than $570 billion of AI‑related debt has been raised since 2025, often through off‑balance‑sheet structures and circular financing. July’s $12.5 billion BlackRock bond for a Meta data center priced at 7.53%, one of the highest yields for an A‑rated jumbo deal in years, and demand was tepid at just 1.6 times oversubscribed. Credit‑default swaps on names like Meta, Oracle, and Alphabet jumped, reflecting investor unease. These deals, once oversubscribed four times over, now struggle to clear, underscoring how the AI borrowing binge is colliding with tighter liquidity and higher costs.
Taken together, July exposed a dual vulnerability: policy credibility at the Fed and structural stress in credit markets. Investors are not only questioning whether the Fed will act, but also whether the market can absorb the scale of issuance from both sovereigns and corporates without breaking down. The dysfunction in high‑grade trading and the cracks in AI‑linked debt demand suggest that the bond market’s resilience is being tested on multiple fronts.
Panda Bonds as a Bastion of Stability
In a recent July 2026 article “Why German issuers are turning to China’s panda bond market in 2026,” Deutsche Bank highlighted a notable trend this year involving European corporates and sovereigns increasingly tapping panda bonds as a stable alternative to G3 markets. What began as a channel for German corporates has broadened to include sovereigns such as Hungary, Poland and Slovenia reflecting how the appeal of RMB financing now extends well beyond the corporate sphere.
The attraction is clear. Panda bonds have been consistently oversubscribed, offering competitive coupons compared to the rising yields in G3 markets. For corporates with significant Chinese operations, RMB debt provides a natural hedge against local revenues, while sovereigns gain access to a deep investor base eager for RMB exposure. More broadly, interest in the Chinese onshore bond market has grown as global investors seek diversification, with issuance volumes surpassing one trillion RMB by mid‑2026.
This shift underscores a global rebalancing of trust. While Western markets wrestle with credibility questions and structural stress, China’s managed policy environment and steady investor demand have positioned panda bonds as a credible alternative anchor. For issuers, they offer predictable access and currency alignment; for investors, they provide diversification and a hedge against volatility elsewhere. The panda bond market is no longer a niche experiment — it is becoming a mainstream pillar in the global funding landscape.
Important Information
This material is provided by Phillip Capital Management (S) Ltd (“PCM”) for general information only and does not constitute a recommendation, an offer to sell, or a solicitation of any offer to invest in any of the exchange-traded fund (“ETF”) or the unit trust (“Products”) mentioned herein. It does not have any regard to your specific investment objectives, financial situation and any of your particular needs. You should read the Prospectus and the accompanying Product Highlights Sheet (“PHS”) for key features, key risks and other important information of the Products and obtain advice from a financial adviser (“FA“) before making a commitment to invest in the Products. In the event that you choose not to obtain advice from a FA, you should assess whether the Products are suitable for you before proceeding to invest. A copy of the Prospectus and PHS are available from PCM, any of its Participating Dealers (“PDs“) for the ETF, or any of its authorised distributors for the unit trust managed by PCM.
An ETF is not like a typical unit trust as the units of the ETF (the “Units“) are to be listed and traded like any share on the Singapore Exchange Securities Trading Limited (“SGX-ST”). Listing on the SGX-ST does not guarantee a liquid market for the Units which may be traded at prices above or below its NAV or may be suspended or delisted. Investors may buy or sell the Units on SGX-ST when it is listed. Investors cannot create or redeem Units directly with PCM and have no rights to request PCM to redeem or purchase their Units. Creation and redemption of Units are through PDs if investors are clients of the PDs, who have no obligation to agree to create or redeem Units on behalf of any investor and may impose terms and conditions in connection with such creation or redemption orders. Please refer to the Prospectus of the ETF for more details.
Investments are subject to investment risks including the possible loss of the principal amount invested, and are not obligations of, deposits in, guaranteed or insured by PCM or any of its subsidiaries, associates, affiliates or PDs. The value of the units and the income accruing to the units may fall or rise. Past performance is not necessarily indicative of the future or likely performance of the Products. There can be no assurance that investment objectives will be achieved. Any use of financial derivative instruments will be for hedging and/or for efficient portfolio management. PCM reserves the discretion to determine if currency exposure should be hedged actively, passively or not at all, in the best interest of the Products. The regular dividend distributions, out of either income and/or capital, are not guaranteed and subject to PCM’s discretion. Past payout yields and payments do not represent future payout yields and payments. Such dividend distributions will reduce the available capital for reinvestment and may result in an immediate decrease in the net asset value (“NAV”) of the Products. Please refer to <www.phillipfunds.com> for more information in relation to the dividend distributions.
The information provided herein may be obtained or compiled from public and/or third party sources that PCM has no reason to believe are unreliable. Any opinion or view herein is an expression of belief of the individual author or the indicated source (as applicable) only. PCM makes no representation or warranty that such information is accurate, complete, verified or should be relied upon as such. The information does not constitute, and should not be used as a substitute for tax, legal or investment advice.
The information herein are not for any person in any jurisdiction or country where such distribution or availability for use would contravene any applicable law or regulation or would subject PCM to any registration or licensing requirement in such jurisdiction or country. The Products is not offered to U.S. Persons. PhillipCapital Group of Companies, including PCM, their affiliates and/or their officers, directors and/or employees may own or have positions in the Products. This advertisement has not been reviewed by the Monetary Authority of Singapore.
